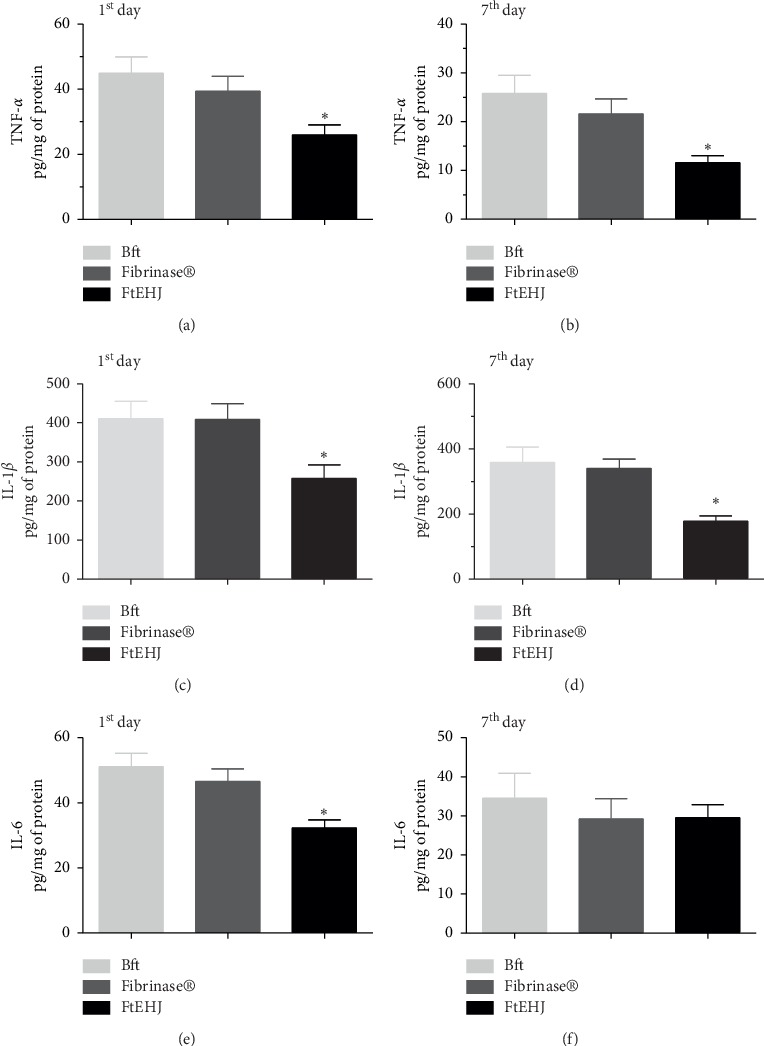
Figure 4.

Cytokines quantification (pg/mg of protein) in cutaneous tissue after the 1st and 7th day after lesion treatment. TNF-α (a) 1st and (b) 7th day, IL-1β (c) 1st and (d) 7th day, and IL-6 (e) 1st and (f) 7th day. The results are expressed as mean ± standard error of the means (n = 5). The difference between the experimental groups was detected by analysis of variance (ANOVA), followed by Newman–Keuls posttest. ∗p < 0.01 FtEHJ versus BFt and Fibrinase. Bft, basis of the topical formulation; FtEHJ, topical formulation of the hydroalcoholic extract of J. decurrens Cham.
