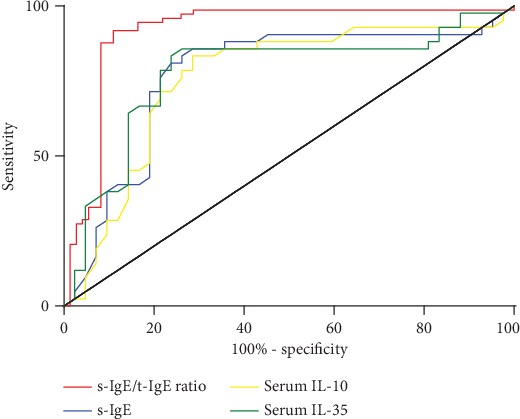
Figure 1.

ROC curves obtained with the serum s-IgE/t-IgE ratio (decision point, 12.6%; sensitivity, 97.2%; and specificity, 74.1%), serum s-IgE levels (decision point, 34.6 IU/mL; sensitivity, 83.3%; and specificity, 74.1%), serum IL-10 levels (decision point, 98.4 pg/mL; sensitivity, 84.5%; and specificity, 72.1%), and serum IL-35 levels (decision point, 195.2 pg/mL; sensitivity, 88.9%; and specificity, 70.6%) by plotting sensitivity in children with an effective response to SLIT versus 100%-specificity in children with an ineffective response to SLIT.
