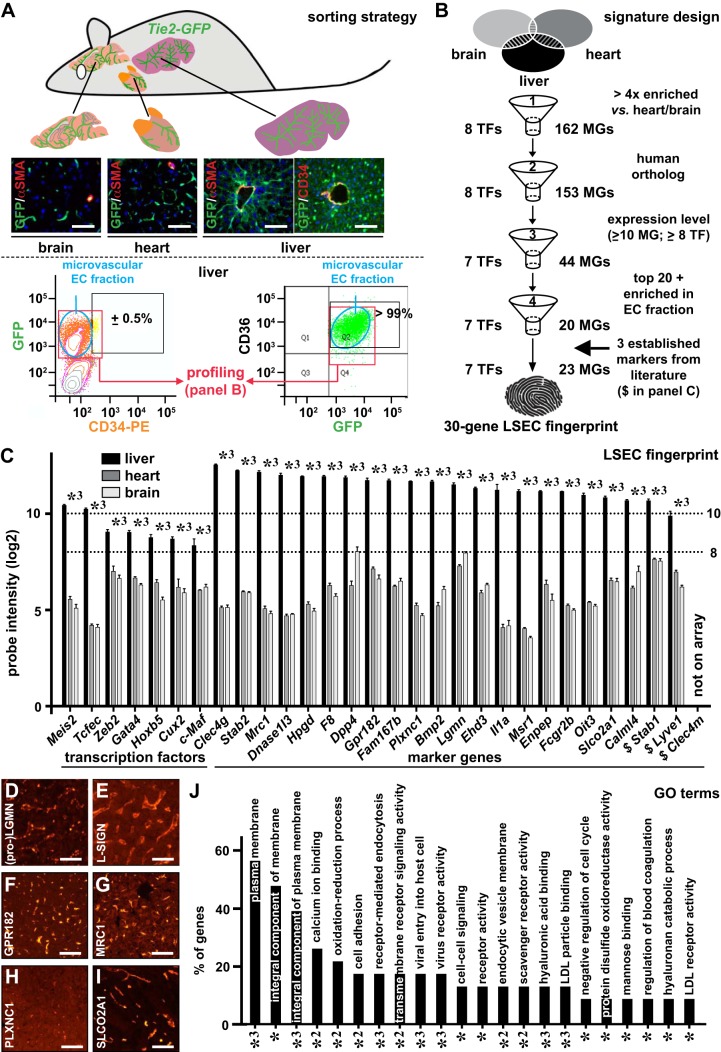
Fig. 1.
Establishment of a 30-gene (human) liver sinusoidal endothelial cell (LSEC) fingerprint. Brains, hearts, and livers were isolated from Tie2-green fluorescent protein (GFP) mice (A), which express GFP specifically in endothelial cells (ECs). Frozen cross-sections of these organs stained for α-smooth muscle actin (αSMA; red) and DAPI (as nuclear counterstain) confirmed GFP expression (green) in all ECs, and costaining for CD34 (red) and GFP (green) on liver cross-sections confirmed CD34 as a macrovascular EC marker. FACS analysis after colabeling of GFP+ ECs from Tie2-GFP livers with CD34 (left) or CD36 (right) revealed that <1% and >99% of the ECs represented macrovascular and microvascular ECs, respectively, such that the profiles of GFP+ cells reflected that of (sinusoidal) capillaries. A (human) LSEC-specific 30-gene signature consisting of genes encoding transcription factors (TFs) (left) and marker genes (right) arranged according liver EC probe set intensity (C) was established from comparative gene expression profiling using a four-step filtering process and by adding three established markers not retained by the filtering process (B). In C, the expression of the 30 genes in mouse livers (closed bars), hearts (dark shaded bars), and brains (light shaded bars) are shown as mean log2 probe intensities ± SE (n = 5 for each organ; *3P < 0.001 vs. heart or brain by ANOVA). Dotted horizontal lines in C indicate the expression threshold levels used in filter step three. Human liver cross-sections (female donor) immunostained (red) for Legumain (LGMN) (D), liver/lymph node-specific ICAM-3 grabbing non-integrin (L-SIGN) (E), G protein-coupled receptor 182 (GPR182) (F), mannose receptor C-type 1 (MRC1) (G), PlexinC1 (PLXNC1) (H), and solute carrier organic anion transporter family member 2A1 (SLCO2A1) (I). Diagram (J) displays annotations [gene ontology (GO) terms] identified by database for annotation, visualization, and integrated discovery analysis significantly (adjusted P-values: *P < 0.05, *2P < 0.01, or *3P < 0.001) associated with the identified LSEC markers, expressed as the % of genes from the 30-gene signature allocated to the corresponding terms. Scale bars = 100 μm in A and D–I. $Established markers.

