Fig. 4.
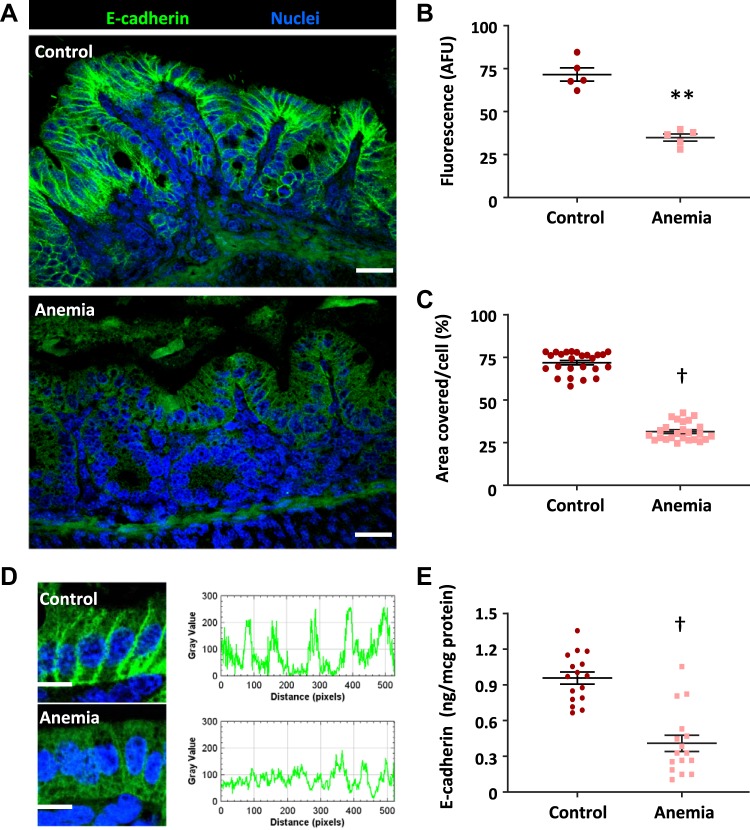
Severe anemia was associated with decreased epithelial E-cadherin protein expression. Fluorescence photomicrographs (×240) showed decreased epithelial immunoreactivity for E-cadherin (green) in anemia (A). Scale bar = 25 μm. Scatter plots (means ± SE) right summarize fluorescence intensity (B) and area covered by E-cadherin staining (C), respectively; n = 5 mice/group. High-magnification images and fluorescence intensity measurements (Image J) showed loss of perimembrane E-cadherin immunoreactivity in anemic colonic epithelial cells (D). Direct measurements in exfoliated epithelial cells (E) showed decreased E-cadherin expression in the anemic colon (n = 16 animals/group); Mann-Whitney U test; **P < 0.01; †P < 0.001. AFU, artificial fluorescence units.

