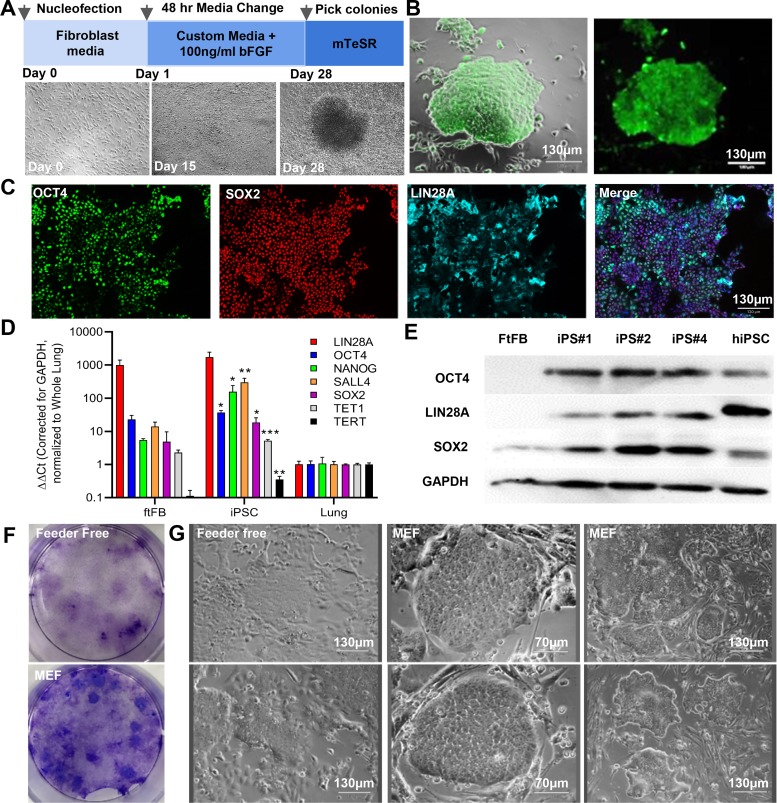
Fig. 1.
Generation of induced pluripotent stem cells from ferret fetal fibroblasts. A: schematic showing the timeline for reprogramming with representative phase-contrast images of ferret induced pluripotent stem cells (iPSC) colony formation. B: live cell alkaline phosphatase (green) staining of a ftiPSC colony. C: representative immunofluorescence images showing expression of pluripotency genes OCT4 (green), SOX2 (red), and LIN28A (cyan). Nuclei are counterstained with DAPI (blue). D: quantitative PCR analysis of ferret pluripotency genes in reprogrammed cells at passage 6–10 compared with ferret fetal fibroblasts (ftFB) and normalized to ferret fetal lung (ftLung). *P < 0.05, **P < 0.01, and ***P < 0.01; n = 4–6 biological replicates each with n = 3 technical replicates. E: Western blots for pluripotency genes OCT4, LIN28A, SOX2, and internal control GAPDH. FtFBs represent the negative control and human iPSCs (hiPSCs) a positive control. F: crystal violet staining of reprogramming day 28 in the presence and absence of MEF feeders. G: representative phase-contrast images of iPS#1 at P4 in the presence and absence of MEF feeders. Scale bars represent 70 and 130 μm, as indicated.

