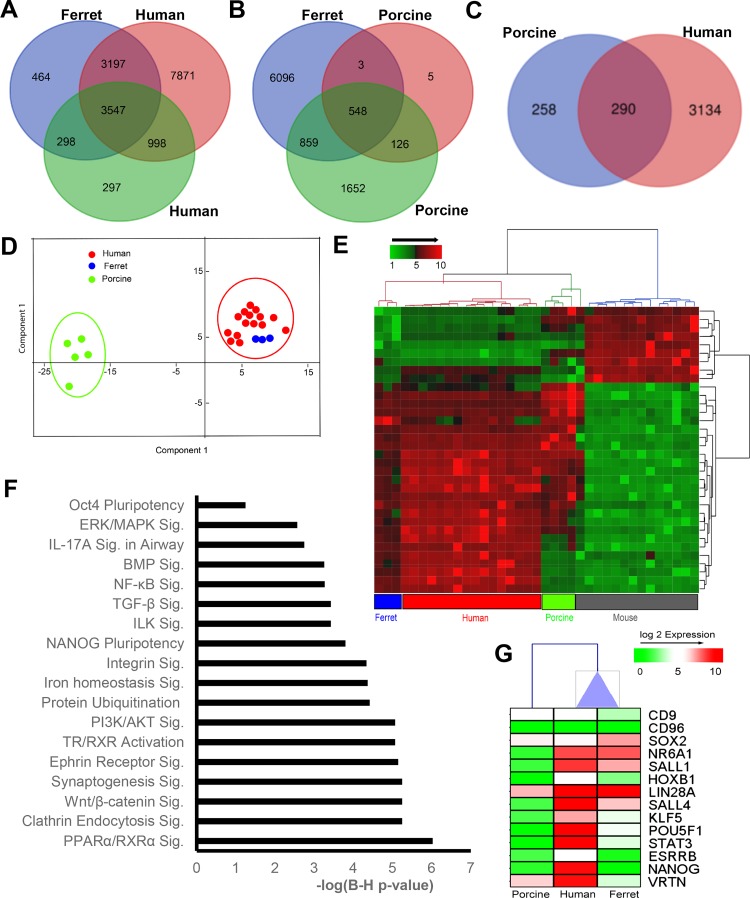
Fig. 3.
Comparative global induced pluripotent stem cells (iPSC) gene signature profiles generated from human and porcine. A Venn diagram showing overlap in the significantly expressed genes in ferret iPSCs with human (A) and porcine (B) iPSCs. C: 290 common genes expressed in ferret iPSCs overlapping with both human and porcine iPSCs. D: unsupervised principal component analysis (PCA) plot of the expression profile of 290 consensus genes among ferret, human, and porcine. Each circle represents an individual sample. E: hierarchical clustering, based on Euclidean distance and average linkage, of 34 consensus genes expressed in ferret, human, porcine, and mouse iPSC data sets. F: pathways enriched in common consensus genes among ferret versus porcine or human iPSCs (refer to C: 290 genes). G: one-way hierarchal clustering of the expression profile of key pluripotent genes in all three species: ferret, human, and porcine. Ferret showed an expression profile closer to humans.

