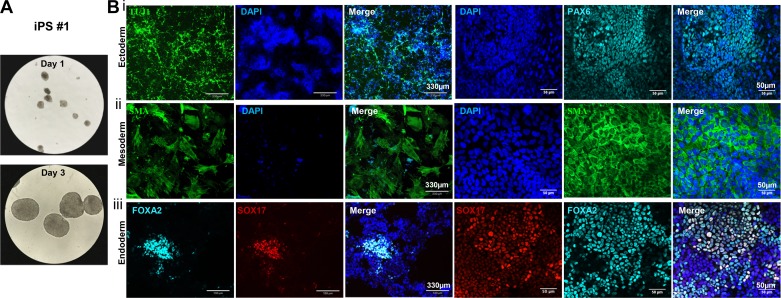
Fig. 4.
Spontaneous differentiation capacity of ferret induced pluripotent stem cells (ftiPSCs). A: representative phase-contrast images of embryoid bodies (EBs) at days 1 and 3 of differentiation for iPS#1. B: representative immunofluorescence images of proteins expressed in each of the three germ layers for iPS#1: i) ectoderm: TUJ1 (green, left) and PAX6 (cyan, right); ii) mesoderm: smooth muscle α-actin (SMA, green), and iii) endoderm: FOXA2 (cyan), SOX17 (red). Scale bars represent 330 µm (left) and 50 µm (right) and all nuclei were counterstained with DAPI (blue).

