Fig. 5.
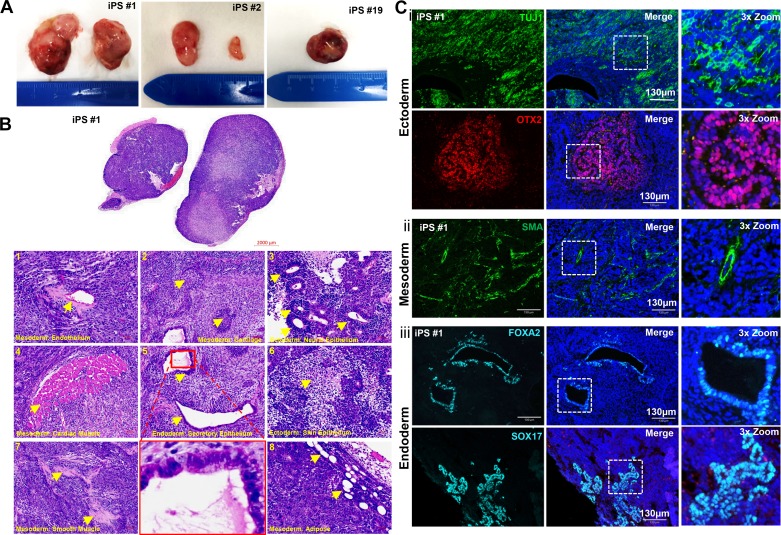
Teratoma formation from ftiPSCs. A: images of teratomas formed from iPS lines #1, #2, and #19. B: representative H&E-stained teratoma sections from iPS#1 showing: 1, endothelial cells; 2, cartilage; 3, neural epithelium; 4, cardiac muscle; 5, secretory epithelium; 6, squamous epithelium; 7, smooth muscle; and 8, adipose cells. Representative cells are indicated by yellow arrowheads. Ci: representative immunofluorescence images for iPS#1 showing TUJ1 (green) and OTX2 (red)-expressing ectodermal cells. ii: smooth muscle α-actin (SMA; green)-expressing mesodermal cells. iii: FOXA2 (cyan) and SOX17 (cyan)-expressing endodermal cells. The white boxes indicate the regions featured in the 3× zoom (right panels). Scale bars represent 2,000 µm (B, whole teratoma), 50 µm (B, panels), and 130 µm (C) and all nuclei are counterstained with DAPI (blue).

