Fig. 1.
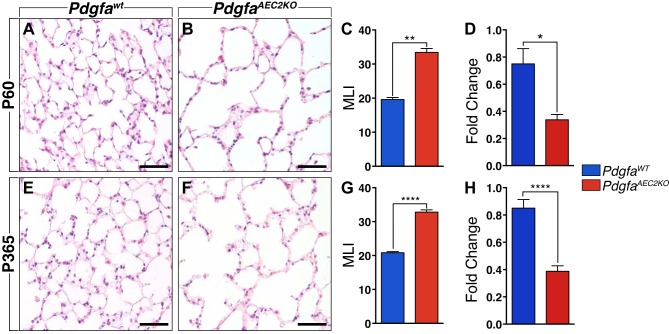
Comparison of adult lung tissue between PdgfaAEC2KO and PdgfaWT mice. Hematoxylin eosin-stained lung paraffin sections of control (A) and knockout (B) mice at postnatal day 60 (P60). C: mean linear intercept (MLI) calculation results comparing control (blue) and knockout (red) alveolar area. D: relative levels of Pdgfa mRNA expression levels normalized to 18s rRNA endogenous control. Hematoxylin eosin-stained lung paraffin sections of control (E) and knockout (F) mice at 1 yr (P365) of age. G: MLI results comparing control (blue) and knockout (red) mice. H: relative levels of Pdgfa mRNA expression levels normalized to 18s rRNA endogenous control. Control mice n = 5–7; knockout mice n = 5–7. Graphs are represented as means ± SE. Statistical analysis was done using Student’s two-tailed unpaired t test and statistical significance is indicated as follows: *P < 0.05, **P < 0.01, ****P < 0.0001. Scale bars: 50 µm.

