Fig. 3.
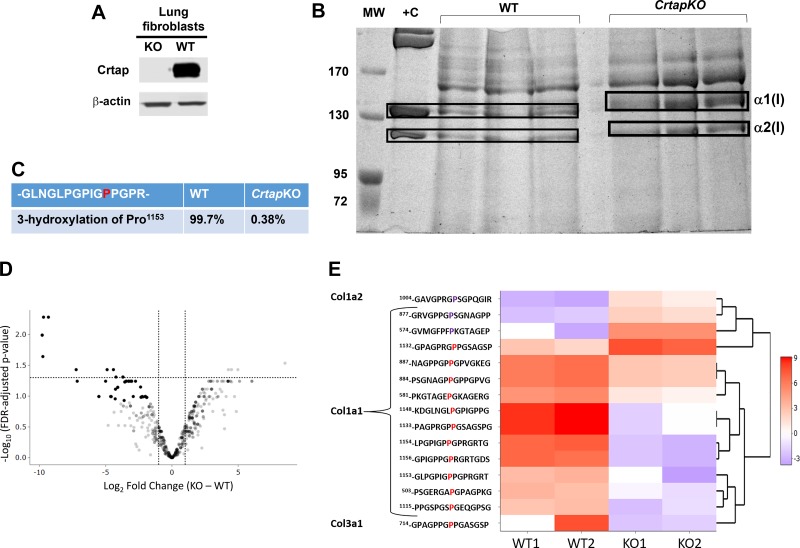
Collagen mass spectrometry from wild-type (WT) and Crtap knockout (KO) lung fibroblasts. A: Western blot of primary lung fibroblast lysates from CrtapKO and WT mice and probed with antibody against Crtap. B: electrophoretic migration of collagen extracted from media of WT and CrtapKO lung primary fibroblasts (n = 3). The gel was stained with Coomassie blue and shows electrophoretic migration delay of α1(I) and α2(I) chains in CrtapKO samples, characteristic of collagen overmodification. +C, positive control, is collagen extracted from rat tail (1 µg/µL). C–E: mass-spectrometry results showing loss of type I collagen 3Hyp at Pro1153 (previously referred to as Pro986 for processed Col1a1) in CrtapKO versus WT fibroblasts (C). D: a volcano plot showing the Linear Models for Microarray Data –log10 FDR adjusted P values and log2-fold changes for all peptides with a 3Hyp modification on prolines that were identified by mass spectrometry. E: a hierarchical cluster heat map displaying the scaled normalized peptide intensity values for each sample and significantly modified peptide. Peptides were considered significant with a fold change >2 and an FDR adjusted P value <0.05. These peptides are also visualized on the volcano plot. The sequence contains the position of the modified amino acid within the protein ± 7 amino acids. The proline in red and purple indicates the modified proline that is either over- or undermodified in WT versus CrtapKO. The numbering of amino acids starts from the first amino acid in the protein sequence.

