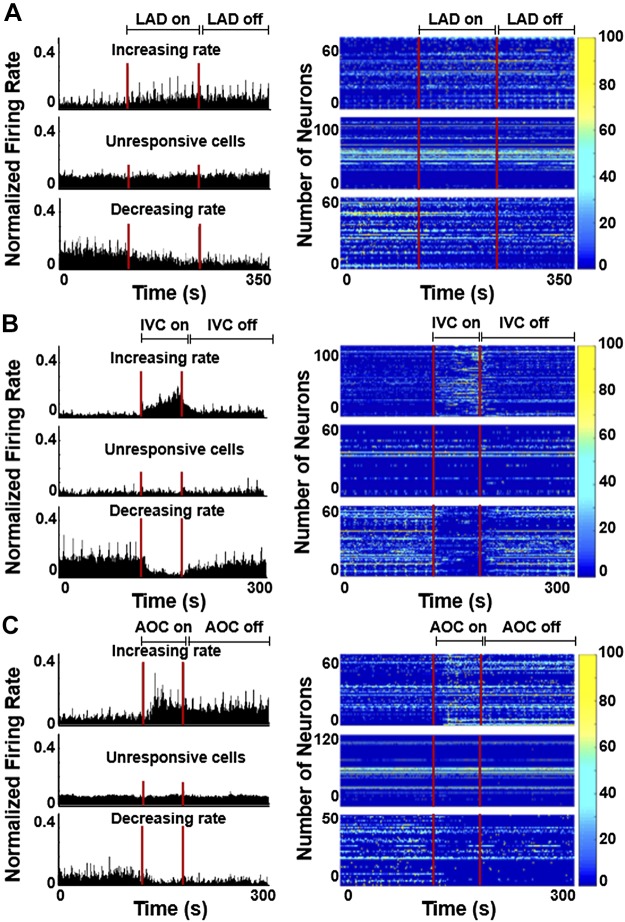
Fig. 2.
Representative changes in normalized firing rate and heat maps of ischemia-sensitive neurons before, during, and after left anterior descending coronary artery (LAD) ligation (A), as well as cardiac load-dependent neurons before, during, and after inferior vena cava (IVC) occlusion (B) and aortic occlusion (AOC; C) of cells that increased (top), were unresponsive (middle), or decreased (bottom) firing during each perturbation. For all heat maps, each row represents the firing rate of a single neuron.

