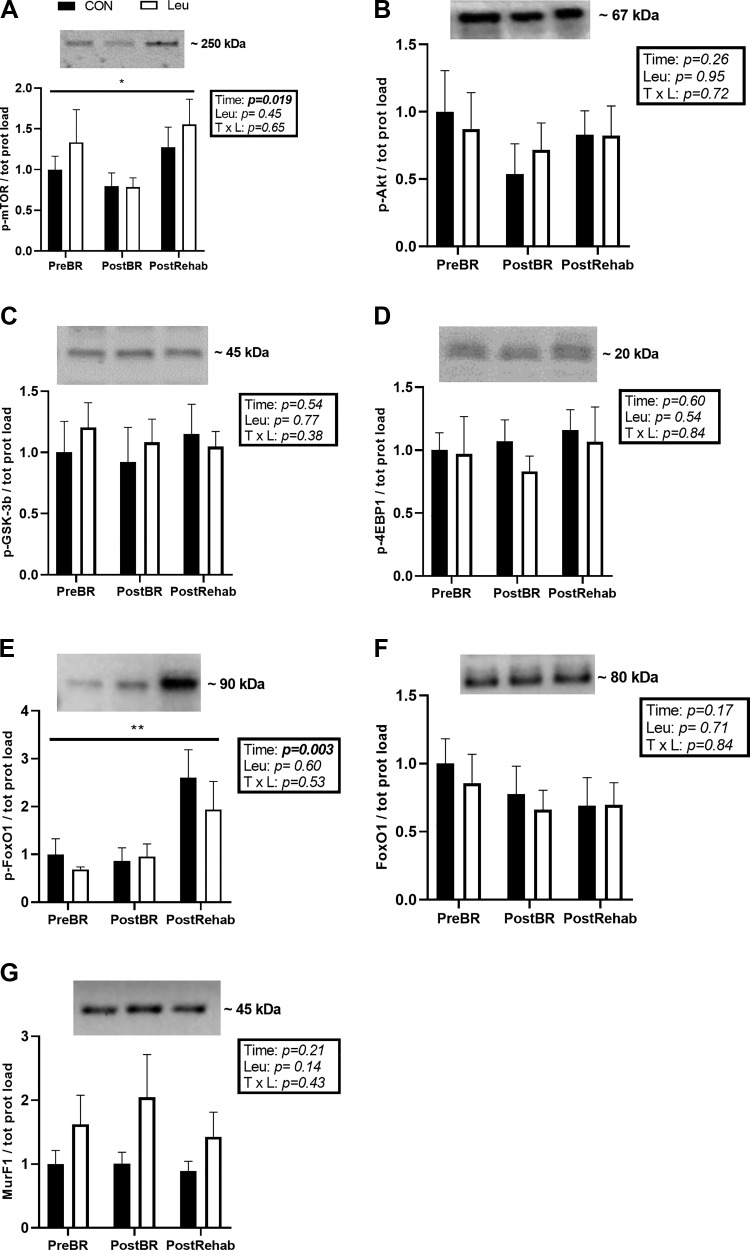
Fig. 3.
Representative immunoblots of phospho-mTORSer2448 (A), phospho-AKTSer473 (B), phospho-GSK-3βSer9 (C), phospho-4E-BP1Thr37∕46 (D), phospho-FoxO1Ser256 (E), total FoxO1 (F), and MuRF1 (G), and corresponding quantification. Data are shown as mean change from before bed rest (PreBR) ± SE at after bed rest (PostBR) and after rehabilitation (PostRehab) with the control (CON) group represented by the black bars (n = 10) and the leucine (LEU) group represented by the white bars (n = 10). There was a main effect of time for phospho-mTOR and phospsho-FOXO1 protein expression. *P < 0.05; **P < 0.01. All samples were derived at the same time and processed in parallel; no adjustment to digital images do alter the information contained therein. Since there was no effect of LEU for any of the proteins or phospho-proteins measured at any time point, a single representative band is displayed for each time point.

