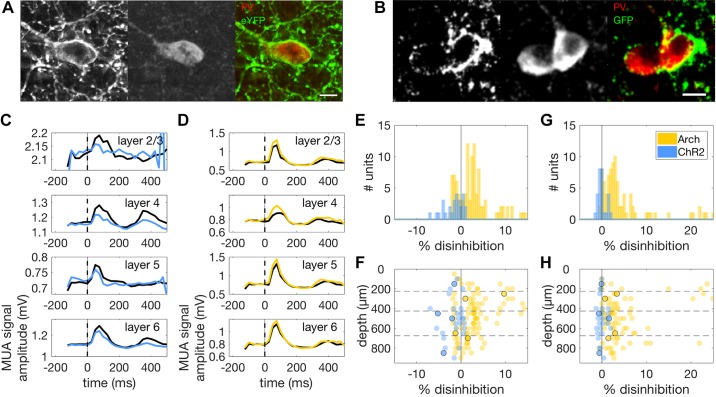
Fig. 3.
A, left: Confocal micrograph of a ChR2-eYFP-positive neuron in a section of mouse auditory cortex. Middle: PV-positive neuron in a slice labeled with a PV antibody and counterstained with a red fluorescent dye. Right: merged image of green (ChR2-eYFP) and red (PV) channels showing coexpression of ChR2-eYFP and PV in the same neuron. Scale bar: 10 μm. B: same as in A but for coexpression of Arch-GFP and PV in two neurons. C: example PSTHs of responses of a MU to 50-ms noise bursts with (blue traces) and without (black traces) optogenetic activation of PVIs. We removed the first 50 ms of the PSTH to exclude photoelectric artifacts from the analysis. All PSTHs show suppression of peak responses under conditions of increased PVI activity (blue), but no suppression of baseline activity (t < 0). D: PSTHs of noise responses for a MU with (amber traces) and without (black traces) optogenetic suppression of PVIs. As in C, control traces with no optogenetic stimulation are shown in black. E: histograms showing the effect of PVI activation (blue) and suppression (amber) on peak firing rate in the PSTH for all MUs that showed noise-evoked responses. PVI activation resulted in inhibition of evoked responses, while PVI suppression resulted in disinhibition of responses to noise stimuli. F: effects of optogenetic manipulations on evoked neural activity across the depth of cortex. Amber circles correspond to individual MUs under PVI suppression (n = 121), while blue circles correspond to individual MUs under PVI activation (n = 28). Units whose responses are illustrated in C and D are indicated here by black circles. PVI activation suppressed noise responses across all cortical layers and did not vary significantly over cortical depth. However, the strength of the disinhibition of noise-evoked responses observed during PVI suppression was found to decrease with cortical depth. G: histograms showing the effect of PVI activation (blue) and suppression (amber) on baseline activity in the PSTH for the same MUs as in E and F. PVI activation had no effect on baseline activity, while suppression resulted in disinhibition of baseline responses. H: effects of optogenetic manipulations on baseline activity across the depth of cortex for the same MUs as in E and F. Units whose responses are illustrated in C and D are again indicated here by black circles. Effects on baseline activity were consistent across the depth of cortex. Arch, archearhodopsin; ChR2, channelrhodopsin; eYFP, enhanced yellow fluorescent protein; GFP, green fluorescent protein; MU, multiunit; MUA, multiunit activity; PSTH, peristimulus time histogram; PV, parvalbumin; PVI, PV-positive interneurons.

