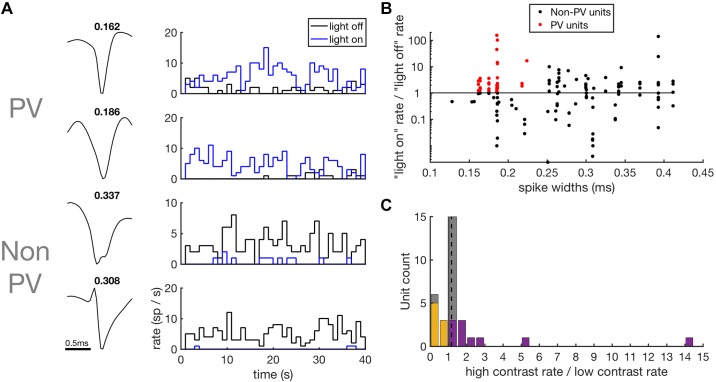
Fig. 8.
Contrast response of putative PVIs. A: spike waveforms and PSTHs of spiking responses of putative PVIs and non-PVIs to high-contrast DRC stimuli with light-off (black) and light-on (blue). Spike widths (ms) are shown above the waveforms. B: scatter plot of spike widths (abscissa) against the strength of the optogenetic response (ordinate), measured as the ratio of firing rates during light-on over light-off conditions. To be classified as a putative PVI (red), units were required to show a significant increase in firing rate during light stimulation and to have spike widths of < 0.25 ms. C: contrast response of putative PVIs. Histogram of the change in firing rates of putative PVIs in response to a doubling of stimulus contrast. Units that showed a significant increase in firing rate are shown in purple and units that showed a significant decrease are shown in orange. No systematic effect of contrast on firing rates was observed. DRC, dynamic random chord; PSTH, peristimulus time histogram; parvalbumin-positive interneurons; PV, parvalbumin; PVI, parvalbumin-positive interneuron.

