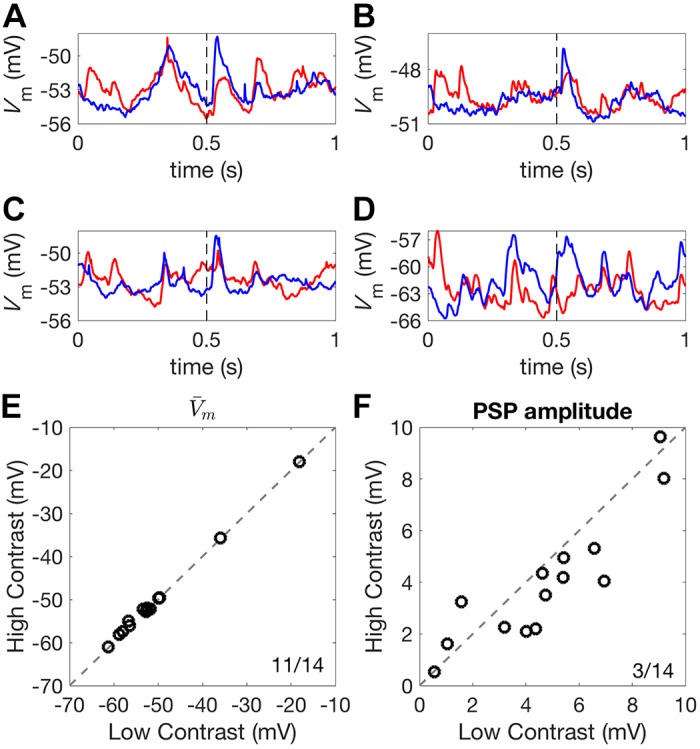
Fig. 9.

Contrast-dependent membrane potential responses. A–D: mean Vm responses to 1-s high-contrast (red) and low-contrast (blue) DRCs for four different auditory cortex neurons. Broken lines indicate the onset of a 50-ms 80 dB SPL noise burst. E: mean Vm showed a very small increase under high-contrast compared with low-contrast stimulation. F: the amplitude of the noise-evoked PSP was increased under low-contrast stimulation, relative to high-contrast stimulation. Ratios in the corner of plots indicate the number of neurons above the identity line, y = x, over the total number of neurons. DRC, dynamic random chord; PSP, postsynaptic potential; Vm, membrane potential.
