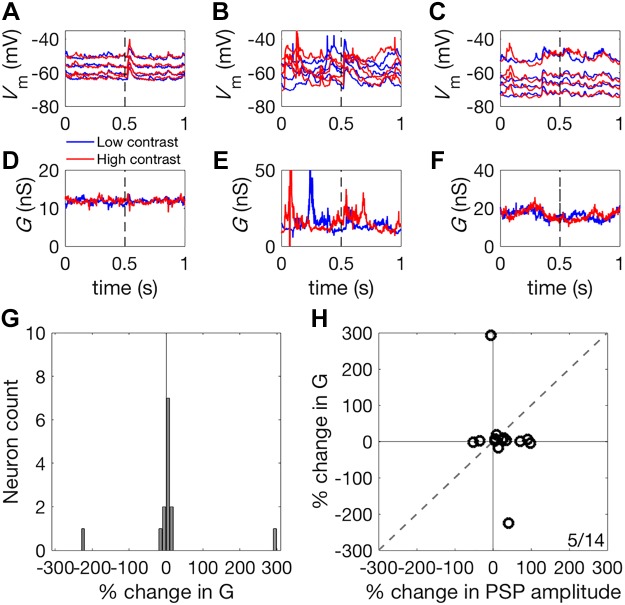
Fig. 11.
Input conductance during high- and low-contrast stimulation. A–C: membrane potential responses recorded under four different levels of current injection for three representative units, during high- (red) and low- (blue) contrast stimulation. Broken lines indicate the timing of noise stimulus presentation. D–F: gain, G, estimated for these same three units under high (red) and low (blue) contrast stimulation. G: histogram of % change in G in response to an approximate doubling of stimulus contrast. Gain, G, showed no systematic variation with stimulus contrast. H: scatter plot of contrast-dependent changes in PSP amplitude (abscissa) and G (ordinate). The change in G between contrast conditions was far smaller than changes that would be required to account for the contrast-dependent scaling of the evoked Vm response. The ratio in the corner indicates the number of neurons above the identity line, y = x, over the total number of neurons. PSP, postsynaptic potential; Vm, membrane potential.

