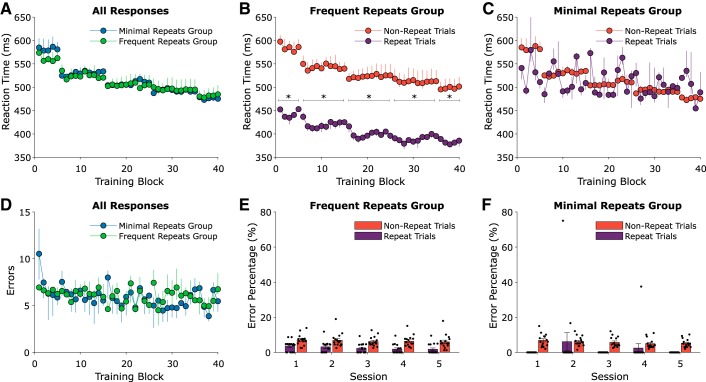
Fig. 4.
Training measures. A: plot of the reaction times during rapid-response trials for both the Minimal Repeats (blue) and Frequent Repeats (green) groups. Each circle represents the average reaction time for correct trials within a 100-trial block. B: plot of the reaction times during rapid-response trials for both non-repeat (red) and repeat (purple) trials of the Frequent Repeats group. C: plot of the reaction times during rapid-response trials for both non-repeat (red) and repeat (purple) trials of the Minimal Repeats group. D: plot of the number of first-attempt errors during rapid-response trials for both the Minimal Repeats (blue) and Frequent Repeats (green) groups. E: plot of the percentage of errors during rapid-response trials for both non-repeat (red) and repeat (purple) trials of the Frequent Repeats group. F: plot of the percentage of errors during rapid-response trials for both non-repeat (red) and repeat (purple) trials of the Minimal Repeats group. In A–D, error bars represent bootstrapped 95% confidence intervals. In E and F (bar charts), error bars are SE. In A–F, n =15 participants in the Minimal Repeats group and n = 16 participants in the Frequent Repeats group.

