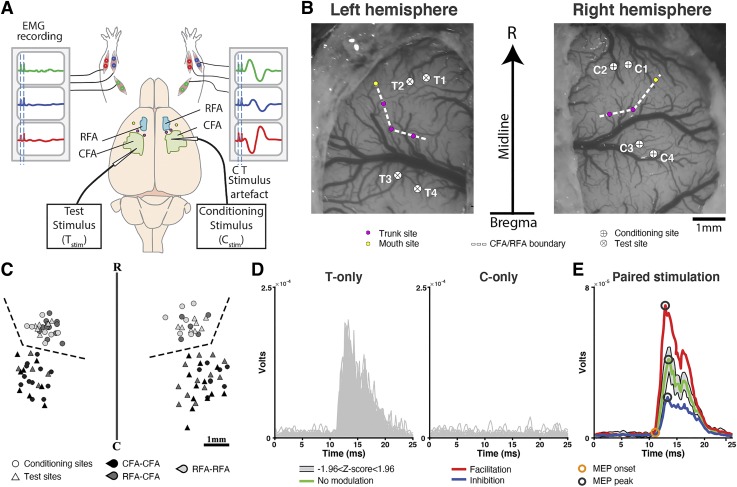
Fig. 1.
Experimental setup and location of cortical stimulation sites. A: schematic representation of the experimental setup. EMG signals from 3 forelimb muscles (WE, wrist extensor; WF: wrist flexor; EF, elbow flexor) implanted bilaterally were analyzed. For paired pulse stimulation protocols, the electrode delivering the conditioning stimulus (Cstim) was positioned in either caudal or rostral forelimb areas (CFA or RFA) of 1 hemisphere. The electrode delivering the test stimulus (Tstim) was positioned in either CFA or RFA of the opposite hemisphere. The stimulation intensity of the Tstim was suprathreshold and evoked EMG responses in the contralateral arm (right arm EMG recording). For the Cstim, the intensity was subthreshold and did not evoke motor-evoked potentials (MEPs) in either arm (left arm EMG recording). B: example of bilateral craniotomy showing the location of the Cstim and Tstim electrodes in a rat. Note that the figure is an exact scaled reproduction of the position and orientation of the 2 craniotomies in relation to the skull midline (vertical arrow) and bregma (horizontal line on the arrow). Intracortical microstimulation techniques (ICMS) trains were first used to locate nonforelimb responses, in this case neck (purple dots) and mouth (yellow dots) movements, to define the border between RFA and CFA (white dashed line). In this animal, a total of 4 paired pulse protocols were conducted. In the first 2 protocols, the Cstim was delivered in RFA (C1 and C2) of 1 hemisphere and Tstim in RFA of the opposite hemisphere (T1 and T2). In the last 2 protocols, the Cstim was delivered in CFA (C3 and C4) of 1 hemisphere and Tstim in CFA of the opposite hemisphere (T3 and T4). C: schematic representation of all Test and Conditioning sites. Test (triangles) and Conditioning (circles) sites for CFA-CFA (black), RFA-CFA (dark gray), and RFA-RFA (light gray) protocols are aligned on the border (dashed line) between RFA and CFA. R, rostral; C, caudal. D: example of responses evoked in WE contralateral to Tstim with single pulses in the Tstim delivered alone (T-only; n = 100; left) and Cstim delivered alone (C-only; n = 100; right) conditions. EMG traces are rectified and smoothed. As expected, the Tstim evoked a clear MEP and the Cstim did not evoke any clear responses. E: to quantify the modulation of the MEP in the paired stimulation conditions, we first calculated a predictor (shaded gray area) based on the responses obtained in the T-only and C-only conditions shown in D. Responses evoked in the paired conditions were compared with this predictor. In this example, when the Cstim was delivered simultaneously with the Tstim [interstimulus interval (ISI)0; red trace], the amplitude of the MEP was significantly greater than the predictors (Z-score ≥ 1.96) and the effect was classified as facilitatory. When the Cstim was delivered 15 ms before the Tstim (ISI15; green trace), the amplitude of the MEP fell within the predictors and the effect was classified nonsignificant. Finally, when the Cstim was delivered 10 ms before the Tstim (ISI10; blue trace), the amplitude of the MEP was significantly smaller than the predictors (Z-score ≤ 1.96) and the effect was classified as inhibitory. Open circles on the traces show the response peak (black) and onset (orange) time that were used to calculate the amplitude of the responses.

