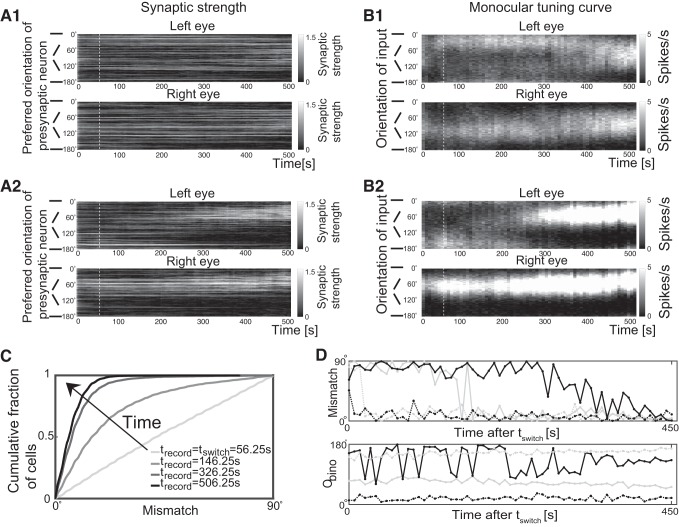
Fig. 4.
Binocular vision reduces the mismatch of the monocular preferred orientations. A1 and A2: two examples of the temporal evolution of the synaptic strengths. The presynaptic neurons are ordered according to their preferred orientation (vertical axis), and their synaptic strengths are illustrated in grayscale as a function of time (horizontal axis). B1 and B2: corresponding evolution of the monocular tuning curves through each eye. Grayscale indicates the firing rate of the cell in response to monocular input with an orientation as indicated along the vertical axis. In A1 and B1 the two monocular preferred orientations drifted toward each other while in A2 and B2 one monocular preferred orientation switched to the other discontinuously to achieve binocular matching. White dashed lines mark t = tswitch. C: the cumulative distribution function of the mismatch at different times (tswitch = 56.25 s; n = 5,600 cells). D: the evolution of the mismatch and the binocular preferred orientation Obino for 4 cells during the binocular phase (BP), showing representative trajectories. The solid black line represents the cell shown in A1 and B1. The solid gray line represents the cell shown in A2 and B2.

