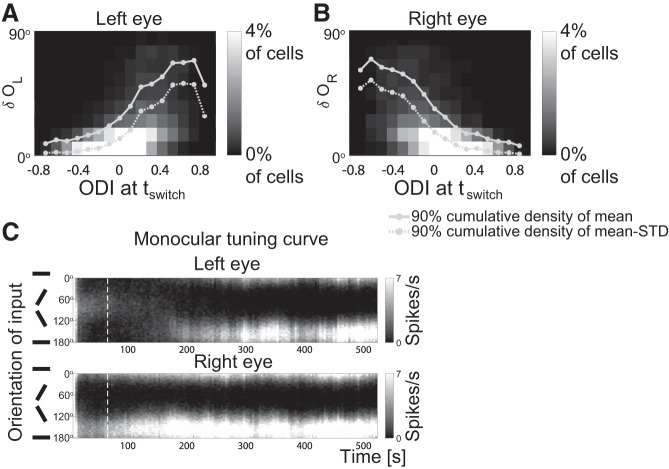
Fig. 5.
Preferred orientation mostly changes for nondominant eye. A: two-dimensional histogram in which the grayscale of each square bin indicates the percentage of cells whose monocular preferred orientation through the left eye changed by δOL (vertical axis) during the binocular phase (BP) and that had an ocular dominance index (ODI) at tswitch as given on the horizontal axis. B: same plot as A, except for the right eye. In both A: and B: tswitch = 56.25 s, tfinal = 506.25 s, n = 5,600 cells. C: the evolution of the monocular tuning curve for input from the left and right eye (cf. Fig. 4B). White dashed lines mark t = tswitch. The scale of the grayscale map is capped to better show the difference between the left and right monocular firing rates at tswitch (ODI>0).

