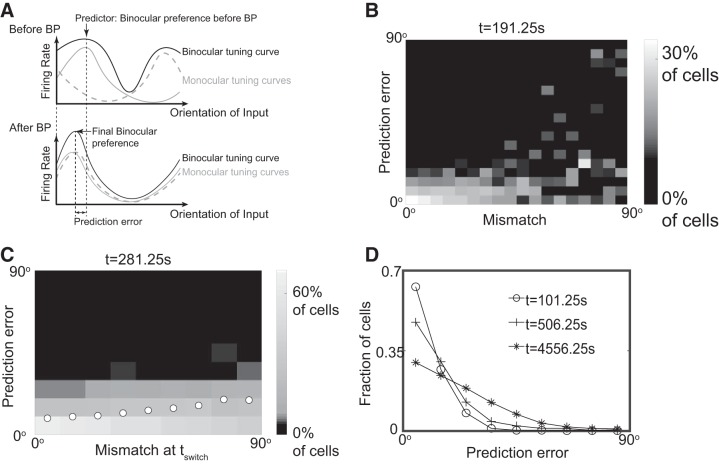
Fig. 8.
Binocular preferred orientation at the onset of binocular phase (BP) predicts the preference after matching. A: the prediction error was calculated as the difference between the binocular preferred orientation before and after BP. B: the quality of the prediction decreased with increasing mismatch. Histogram of the prediction error for different values of the mismatch, both at the same time t = 191.25 s. The histogram is normalized separately for each value of the mismatch. C: the accuracy of prediction decreased with the initial mismatch. Like B, but at t = 281.25 s and using the initial mismatch. Circles represent the mean prediction error of the trials for each value of initial mismatch. D: the mean prediction error increased with time. The distribution of the prediction error from well-matched cells (mismatch <20°) at three intermediate times during BP. In all figures, tswitch = 56.25 s and n = 5,600 cells.

