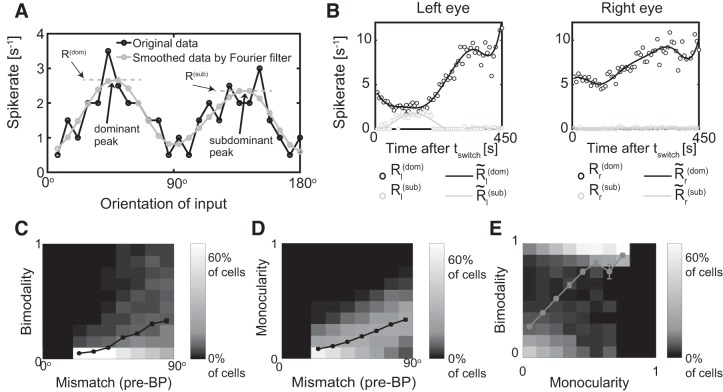
Fig. 11.
The type of matching depends on the initial mismatch, the bimodality index B, and the monocularity index M. A: identifying dominant and subdominant preferred orientations in each eye at time t. Black, noisy monocular tuning curve; gray, smoothed data using a four-mode Fourier filter (data from Fig. 4B). B: temporal evolution of the dominant and the subdominant monocular response amplitudes of each eye (circles). (lines) denotes the data smoothed by a piecewise cubic spline with five nodes. The cell is bimodal through the left eye near time t = 150 s and monocular through the right eye. C: histogram of the bimodality index B for different values of the mismatch at the onset of binocular phase (BP). D: histogram of the monocularity index M for different values of the mismatch at the onset of BP. E: combined histogram of the bimodality index B and the monocularity index M. The lines in C, D, and E denote the mean of the bimodality index B for different values of the mismatch (C) and the monocularity (E) and the mean of the monocularity index M for different values of the mismatch (D). Error bars denote the SE, some of which were smaller than the symbol size.

