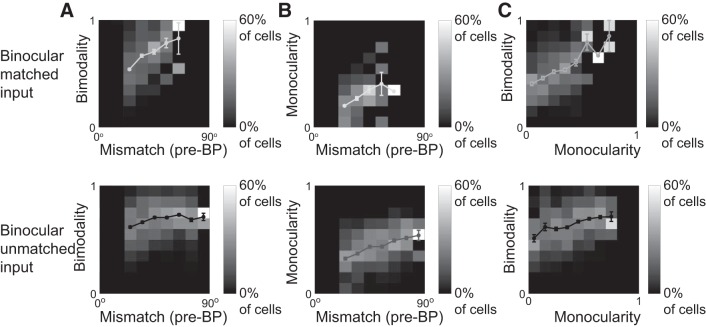
Fig. 12.
Shifting and switching depend on mismatch also for binocular inputs. Top: binocular, perfectly matched inputs. Bottom: binocular, unmatched inputs. A: histogram of the bimodality index B for different values of the mismatch at the onset of binocular phase (BP). C: histogram of the monocularity index M for different values of the mismatch at the onset of BP. C: combined histogram of the bimodality index B and the monocularity index B. The lines indicate the respective means with error bars denoting the SE; the single point without error bar in the top panel of B and C for the initial mismatch belonging to (60°, 70°] represents a single cell.

