Fig. 5.
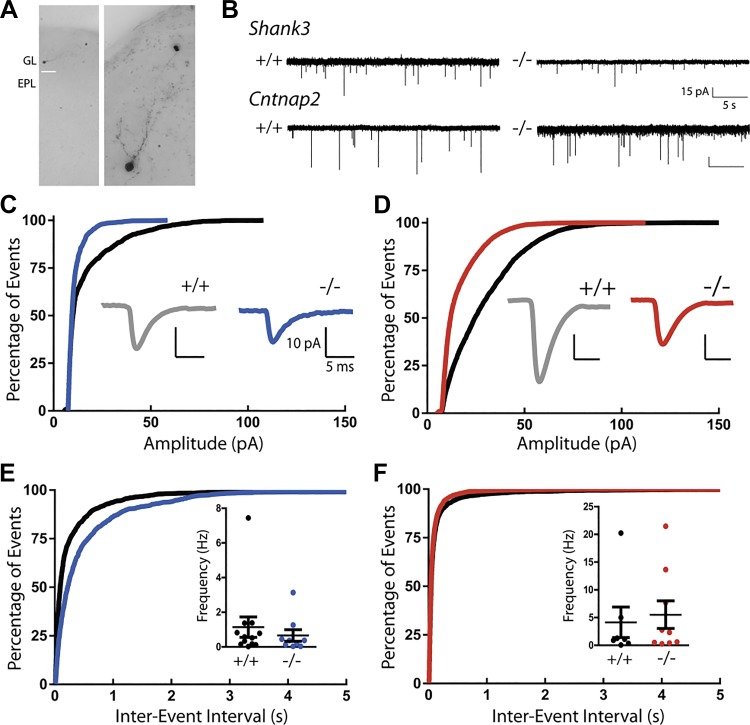
Miniature excitatory postsynaptic current (mEPSC) amplitude at synapses onto periglomerular cells (PGCs) is reduced in Cntnap2- and Shank3-deficient mice. A: images of a Neurobiotin-filled PGC in the glomerular layer (GL) of the olfactory bulb. EPL, external plexiform layer. B: example traces of mEPSCs (0.5 µM TTX) measured from PGCs. C: cumulative frequency distribution of amplitude from all events. Inset: average mEPSC trace from PGCs in Shank3 +/+ and −/− mice. D: cumulative frequency distribution of amplitude. Inset: average trace from PGCs in Cntnap2 +/+ and −/− mice. mEPSC amplitude is decreased in PGCs in both Shank3 (C) and Cntnap2 (D) KO mice (Shank3 KO vs. WT, P < 0.0001; Cntnap2 KO vs. WT, P < 0.0001 by Kolmogorov–Smirnov test). E: cumulative frequency distribution of interevent interval from all events. Inset: average mEPSC frequency from each cell in Shank3 +/+ and −/− mice showing no difference between groups (KO vs. WT, P = 0.49 by t test with Welch’s correction). F: cumulative frequency distribution of interevent interval. Inset: average frequency from PGCs in Cntnap2 +/+ and −/− mice, also showing no difference between conditions (KO vs. WT, P = 0.72 by t test with Welch’s correction). Data in C and E are taken from 1,655 events in 12 WT cells from 5 animals and 720 events in 9 KO cells from 4 animals. Data in D and F are taken from 3,480 events in 7 WT cells from 3 animals and 5,966 events in 9 KO cells from 5 animals.

