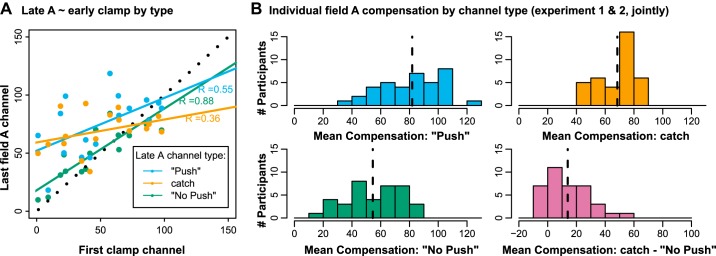
Fig. 5.
A: scatterplot with least squares regression lines: last channel of field A practice for the different types against the first clamp channel. Black dotted line is identity. B: histograms of individual means of force compensation index across field A practice (joint data from experiments 1 and 2). Dashed, vertical lines mark group means. Bottom right shows individual differences between No Push and Catch channels.

