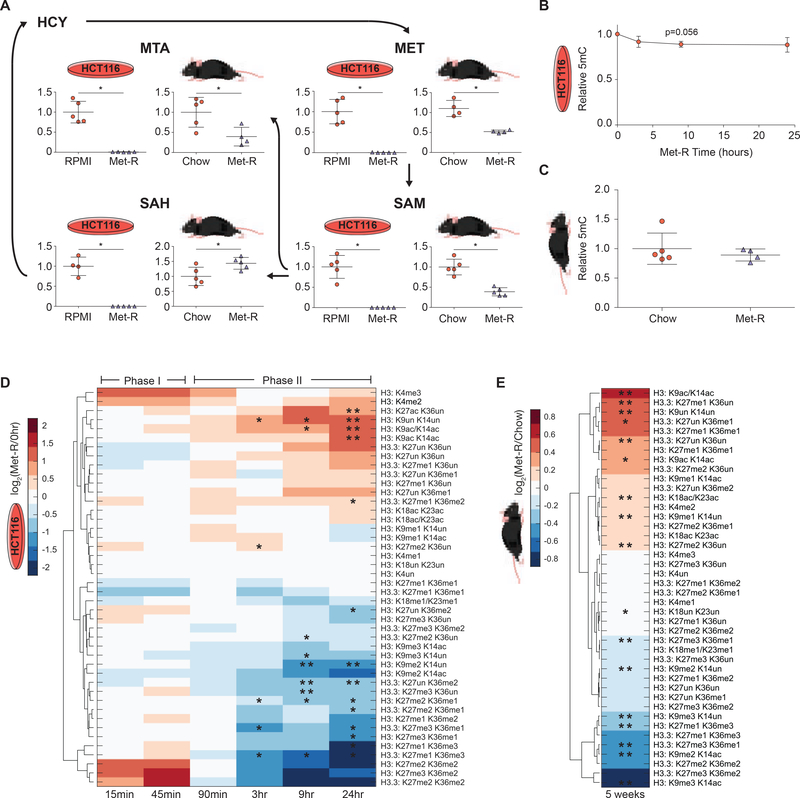
Figure 1. Methionine Restriction Stimulates Global, Dynamic Histone PTM Response.
(A) Metabolic pathway diagram illustrating changes in Met-cycle metabolite abundance after 24 hours and 5 weeks of Met-restriction in HCT116 cells and C57BL/6J liver, respectively. n=5, error bars represent SD, *p<0.05 (Welch’s t-Test). (B-C) Plots illustrating global, relative 5mC DNA methylation levels during Met-restriction. n≥3, error bars represent SD, *p<0.05 (Welch’s t-Test) (D-E) Hierarchical clustered heatmaps of LC-MS/MS generated log2 fold-change stoichiometric histone H3 peptide proteoform values relative to 0-hour or chow diet controls in HCT116 cells and C57BL/6J liver, respectively. n≥3, *p<0.05, **p<.01 (Welch’s t-Test). See also Table S1 and Figure S1.

