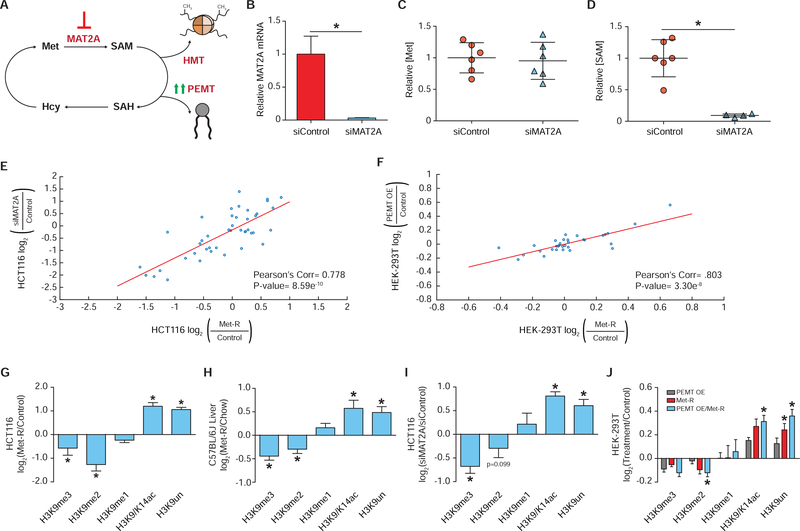
Figure 2. SAM Availability Drives Robust Histone Methylation Response.
(A) Pathway diagram illustrating experimental approaches to depleting intracellular SAM availability. (B) Bar graph of relative MAT2A mRNA abundance in HCT116 cells as measured by RT-qPCR. n≥2, error bars represent SD, *p<0.05 (Welch’s t-Test). (C-D) Dot plots of relative Met and SAM levels in HCT116 cells. n≥4, *p<0.05 (Welch’s t-test). (E-F) Correlation plot of LC-MS/MS generated log2 fold-change stoichiometric values for individual histone H3 peptide proteoforms. n=3. (G-J) Bar graphs illustrating LC-MS/MS generated log2 fold-changes for individual H3K9 PTMs. n≥2. *p<0.05 (Welch’s t-test) See also Table S1, Table S2, and Figure S2.

