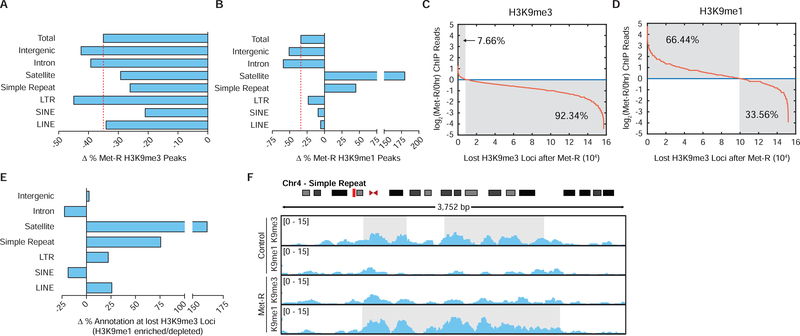
Figure 4. H3K9me1 is Redistributed Over Repetitive and Transposable Elements During SAM Depletion.
(A-B) Bar graphs illustrating percent changes in H3K9 PTM peak number at various annotated loci after 24 hours of Met-restriction in HCT116 cells. (C-D) Plots depicting changes in normalized H3K9 PTM ChIP-sequencing reads to loci of lost H3K9me3 after 24 hours of Met-restriction in HCT116 cells. (E) Bar graphs illustrating percent changes in loci annotation for regions of lost H3K9me3 experiencing increased relative to decreased H3K9me1 ChIP-sequencing read enrichment after 24 hours of Met-restriction in HCT116 cells. (F) Representative ChIP-sequencing track image.

