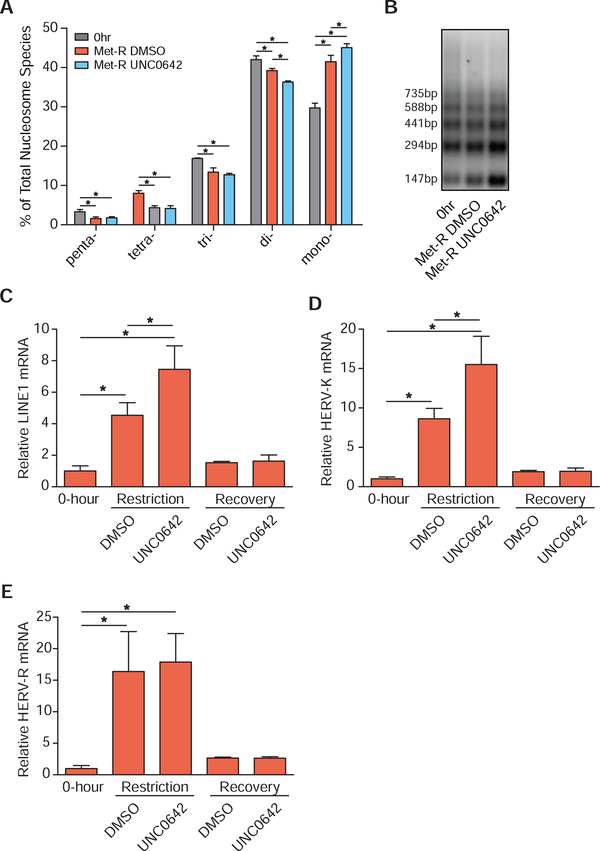
Figure 5. Preferential H3K9 Mono-methylation Preserves Heterochromatin Stability.
(A) Bar graph illustrating the percent abundances of 5 distinct nucleosome species following MNase digestion of HCT116 cells. Met-restriction coupled with mock (DMSO) or UNC0642 treatment was performed for 24 hours. n≥3, error bars represent SD, *p<0.05 (Welch’s t-Test). (B) Representative DNA agarose gel image of those used for the quantification presented in Figure 5A. (C-E) Bar graphs illustrating relative mRNA abundances of LINE1, HERV-K, and HERV-R in HCT116 cells as measured by RT-qPCR. Met-restriction coupled with mock (DMSO) or UNC0642 treatment was performed for 24 hours. Recovery in Met-replete media from either treatment occurred for 24 hours before harvest. n 4, error bars represent SD, *p<0.05 (Welch’s t-Test). See also Table S2.

