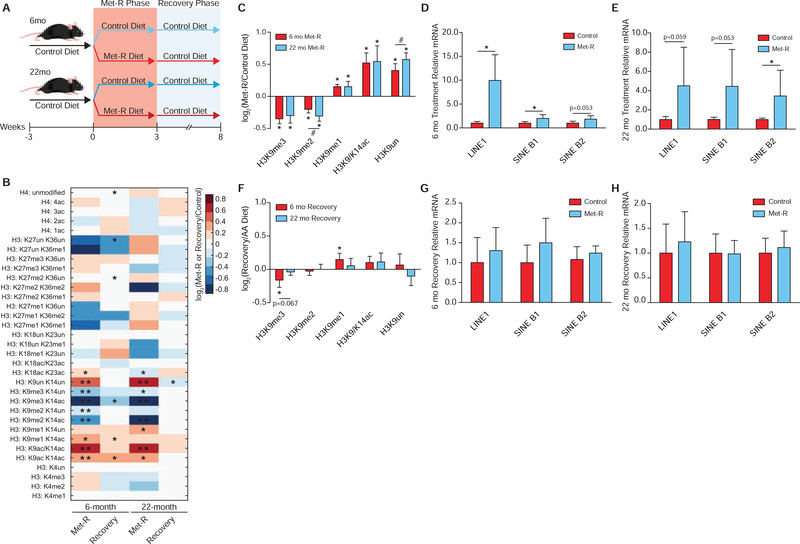
Figure 7. Responses to Ensure Epigenetic Persistence Under SAM Depletion are Robust in vivo, Independent of Age.
(A) Diagram depicting the experimental design for in vivo Met-restriction of 6- and 22-month C57BL/6J mice followed by dietary Met-reintroduction. (B) Heatmap of log2 fold-change stoichiometric values for histone H3 and H4 peptides in C57BL/6J liver relative to age-matched controls as measured by LC-MS/MS. n≥5, *p<0.05, **p<0.01 (Welch’s t-Test). (C) Bar graph illustrating log2 fold-changes for individual H3K9 PTMs in liver from Met-restricted C57BL/6J mice relative to age-matched controls as measured by LC-MS/MS. n≥5, error bars represent SD, *p<0.05 (Welch’s t-Test) within PTM, #p<0.05 (Welch’s t-Test) across PTMs. (D-E) Bar graphs illustrating relative mRNA abundances of LINE1, SINE B1, and SINE B2 in C57BL/6J liver as measured by RT-qPCR. n≥5, error bars represent SD, *p<0.05 (Student’s t-Test). (F) Bar graph illustrating log2 fold-changes for individual H3K9 PTMs in liver from C57BL/6J relative to age-matched controls as measured by LC-MS/MS. n≥5, error bars represent SD, *p<0.05, (Welch’s t-Test). (G-H) Bar graphs illustrating relative mRNA abundances of LINE1, SINE B1, and SINE B2 in C57BL/6J liver as measured by RT-qPCR. n≥5, error bars represent SD, *p<0.05 (Student’s t-Test). See also Table S1, Table S2, and Figure S7.

