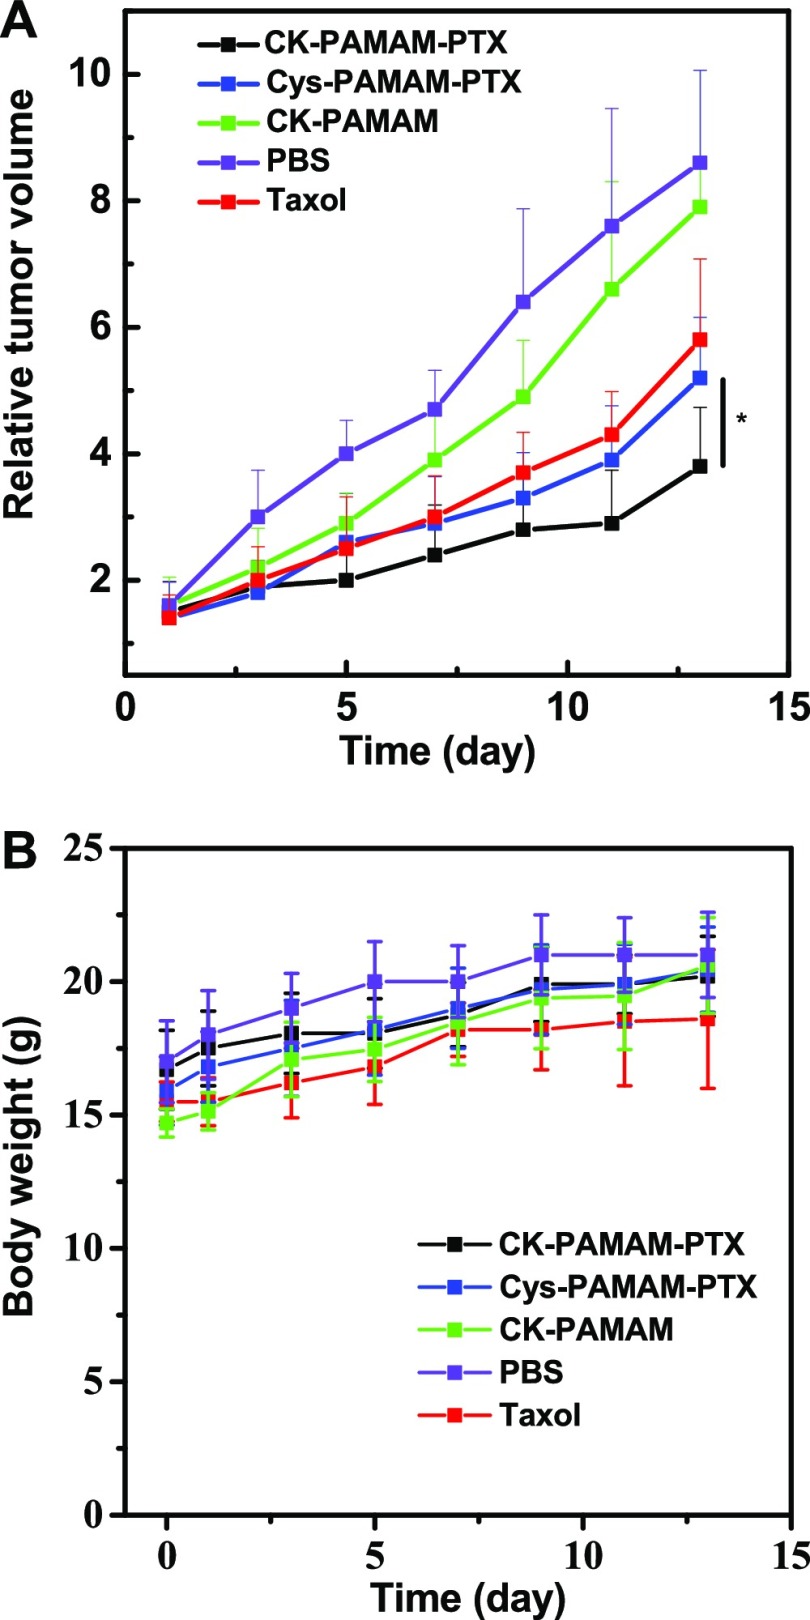
Figure 9.
(A) In vivo antitumor effectiveness of each treated group, expressed as the average value of the relative tumor volume v/v0 (*P < 0.05 versus Cys-PAMAM-PTX injection group, n = 6; the day of injection was set as day 0). (B) Evolution over time of the body weights of each group during the experiments.

