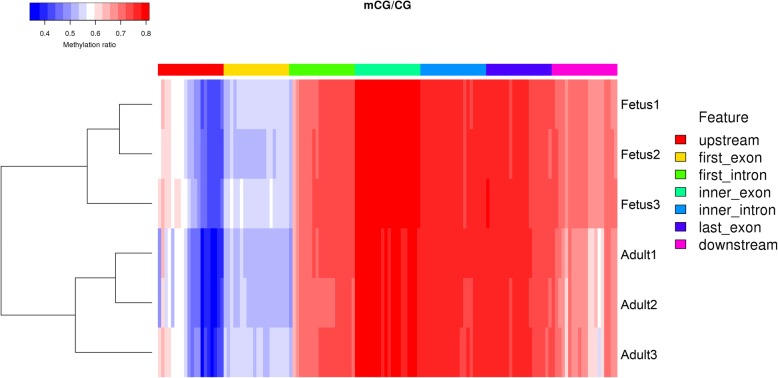
Fig. 6.
Heat map cluster analysis of differentially methylated regions (DMRs) in different gene functional regions. In the heat map, highly methylated loci are displayed in red and sparsely methylated loci in blue. In addition, the red, yellow, green, turquoise, blue, purple, and pink colors indicate upstream, first exon, first intron, inner exon, inner intron, last exon, and downstream, respectively, and are shown above the heatmap

