Fig. 1.
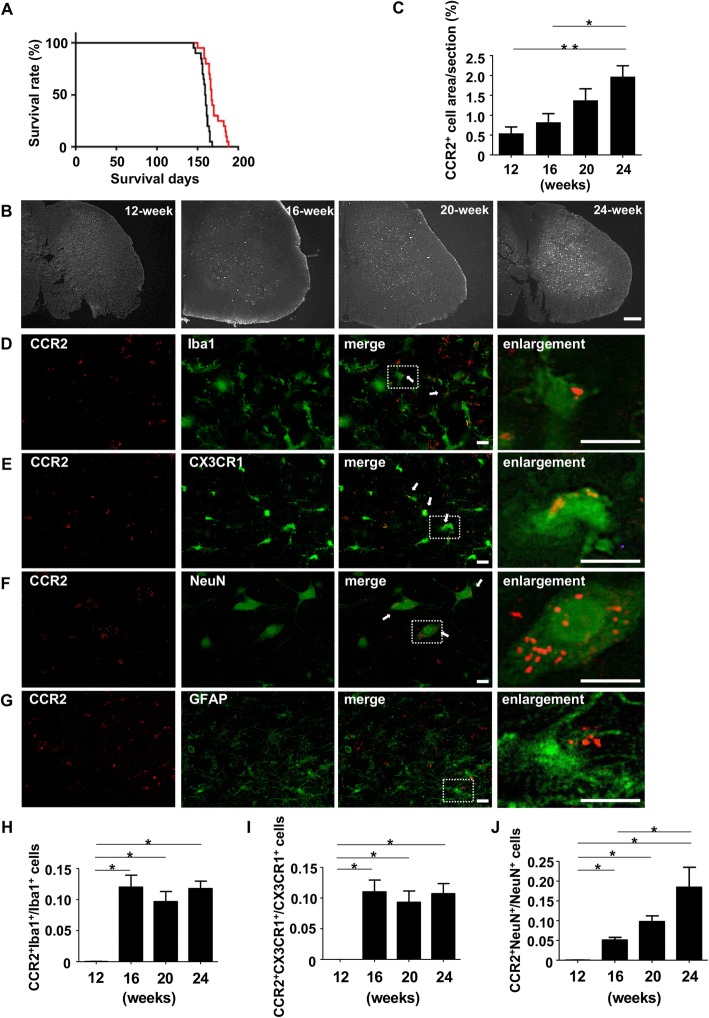
CCR2+ cells in the lumbar spinal cord of ALS mice. a Survival curve of mice. Red line, Ccr2rfp/+-Cx3cr1gfp/+-SOD1G93A Tg mice; black line, SOD1G93ATg mice (n = 20 in each group). b Representative low-magnification microscopic images of L5 lumbar spinal cord of Ccr2rfp/+-Cx3cr1gfp/+-SOD1G93A Tg mice. The abundance of CCR2+ cells increased over the course of disease progression (12-week, early stage; 16-week, middle stage; 20-week, late stage; 24-week, end stage). Scale bar, 100 μm. c Percentage of CCR2+ cells area in L5 lumbar spinal cord (n = 5). *, p < 0.05. **, p < 0.01. d–g Immunofluorescence micrographs of L5 lumbar spinal cords in 24-week, end-stage ALS mice revealed that CCR2 (red) was localized in (d) infiltrating monocytes and microglia (Iba1, green), (e) microglia (CX3CR1, green), and (f) neurons (NeuN, green), but not in (g) astrocytes (GFAP, green). The right panels show enlargements of the dotted areas in the merged images in D–G. Scale bar, 10 μm. h–j Percentage of CCR2+ cells for (H) Iba1+ infiltrating monocytes and microglia, (i) CX3CR1+ microglia, and (j) NeuN+ neurons (12-week, early stage; 16-week, middle stage; 20-week, late stage; 24-week, end stage). *, p < 0.05

