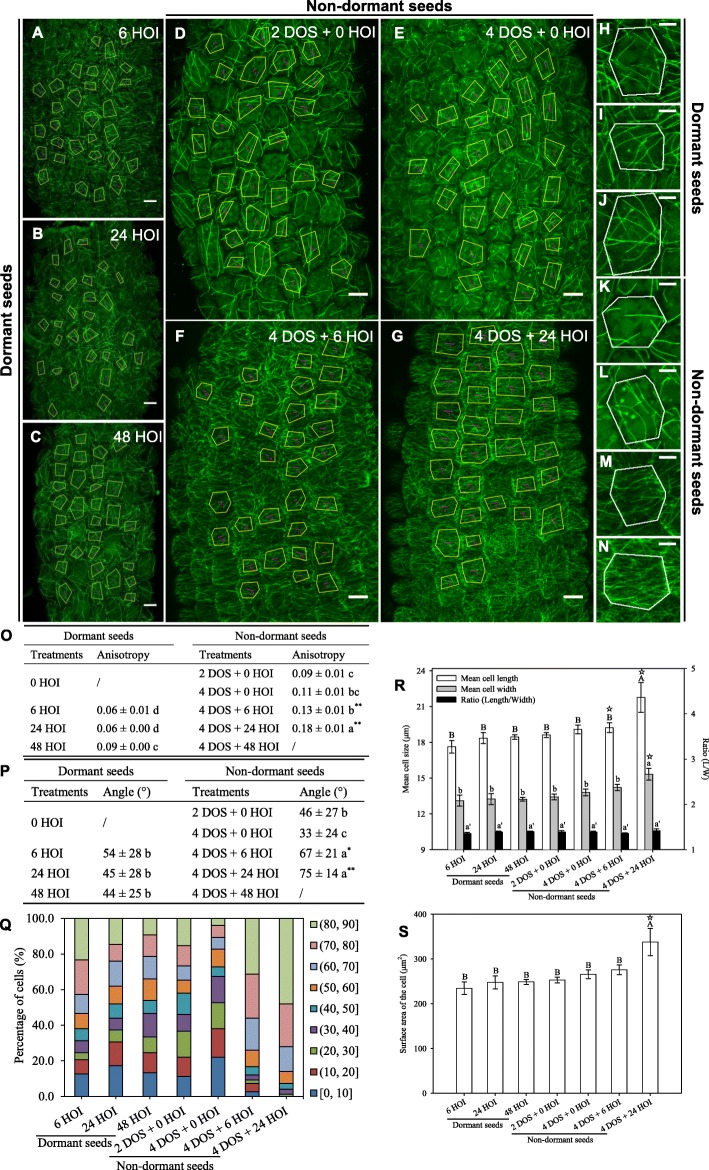
Fig. 1.
Microtubule organisation and hypocotyl cell shape in imbibed dormant and non-dormant p35S::GFP-MBD seeds. Microtubule average orientation (purple lines inside the cells) was obtained using FibrilTool in the regions of interest (cells excluding anticlinal walls) that are delineated with yellow lines (scale bars, 10 μm). Dormant seeds were imbibed at 25 °C in the dark for 6, 24 and 48 h (hours of imbibition (HOI)) or stratified for 2 and 4 days (days of stratification (DOS)) then imbibed for 6 and 24 h at 25 °C in the dark. Details of microtubule organisation are shown in individual cells of dormant embryos at 6, 24 and 48 HOI (h, i, j, respectively) and in cells of seeds after 2 DOS (k) and 4 DOS (l) followed by 6 (m) and 24 (n) HOI. Values of anisotropy (o) and angles (p) were calculated for the same samples. In (o, p) different letters indicated significant differences among all treatments (one-way ANOVA), and asterisks indicate significant difference between non-dormant seeds and dormant seeds at every the same time point (t test, *P < 0.05, **P < 0.01). q Angle distribution (expressed in %) among cells is shown for every sample. Changes in cell shape were evaluated by measuring cell length and width (r) and area (s), in which different letters indicate significant differences among all samples (one-way ANOVA), and stars indicate significant difference between non-dormant seeds and dormant seeds at every the same time point (t -test, ☆P < 0.05). Values of CMT array angles (p) are expressed as means ± s.d., and values of CMT array anisotropy (o) and cell shape (r, s) are expressed as means ± s.e. (5 biological replicates were analysed, and 30 cells from each replicate were used to calculate the anisotropy, angles and cell shape)

