
Fig. 3.
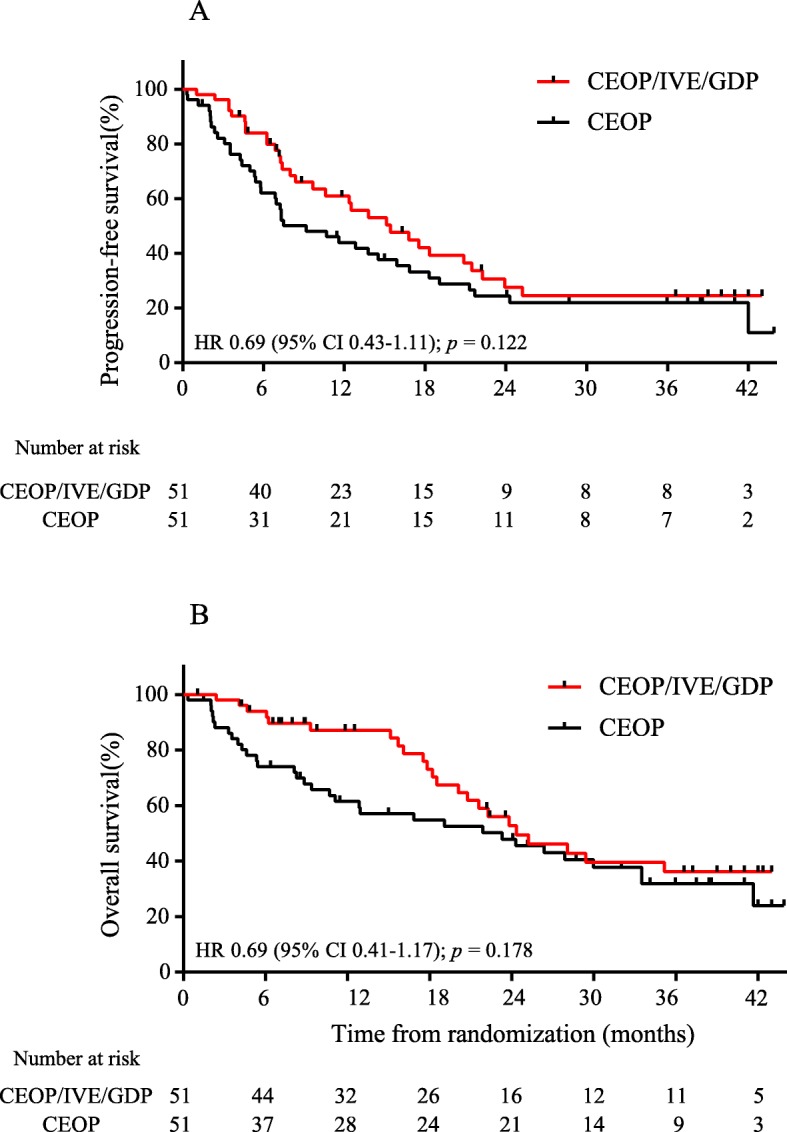
Treatment response and survival outcomes. Kaplan-Meier curves showed (a) progression-free survival and (b) overall survival of the CEOP/IVE/GDP group and of the CEOP group. HR = hazard ratio
Official websites use .gov
A
.gov website belongs to an official
government organization in the United States.
Secure .gov websites use HTTPS
A lock (
) or https:// means you've safely
connected to the .gov website. Share sensitive
information only on official, secure websites.
Treatment response and survival outcomes. Kaplan-Meier curves showed (a) progression-free survival and (b) overall survival of the CEOP/IVE/GDP group and of the CEOP group. HR = hazard ratio