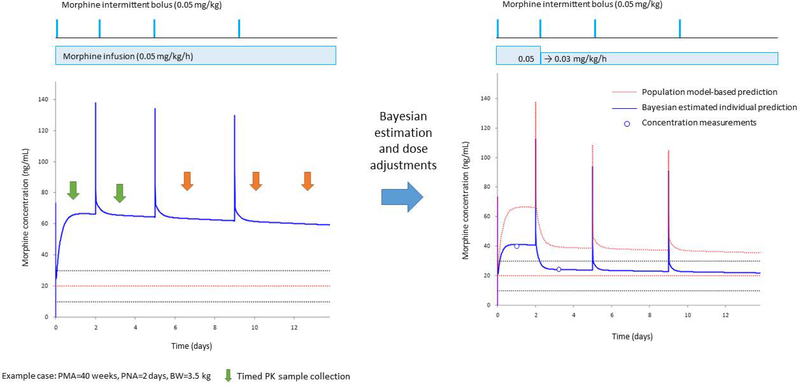
Fig. 3.
Bayesian estimation integrated within the electronic health record allows for precision dosing in neonates. The figure represents model-based PK simulations for a standard neonate (postmenstrual age: 40 weeks, postnatal age: 2 days and body weight: 3.5 kg) as an example. The left panel shows the population PK model-based morphine PK profile (solid blue line) for a standard morphine initial continuous infusion and “as needed” bolus doses. The Upper panel represents the morphine doses for intermittent bolus (horizontal lines) and continuous infusion (box). The dotted lines represent the potential target concentration range of 10–30 ng/mL (mean 20 ng/mL in red). Vertical arrows represent the time of PK sample collection by timed (green) or opportunistic sampling (orange). The right panel shows the adjusted dose and resulting individual PK profile based on the Bayesian estimation. The observed concentrations (open circles) were less than the expected concentration based on the population PK profile (dotted red line) suggesting this neonate had a higher clearance when compared to the average neonate. Therefore, the continuous infusion dose was decreased by 40% to target to the individual predicted concentration (blue line) fitted within the suggested target range (horizontal dotted lines). (Figure courtesy of Dr. Tomoyuki Mizuno, Cincinnati Children’s Hospital Medical Center)

