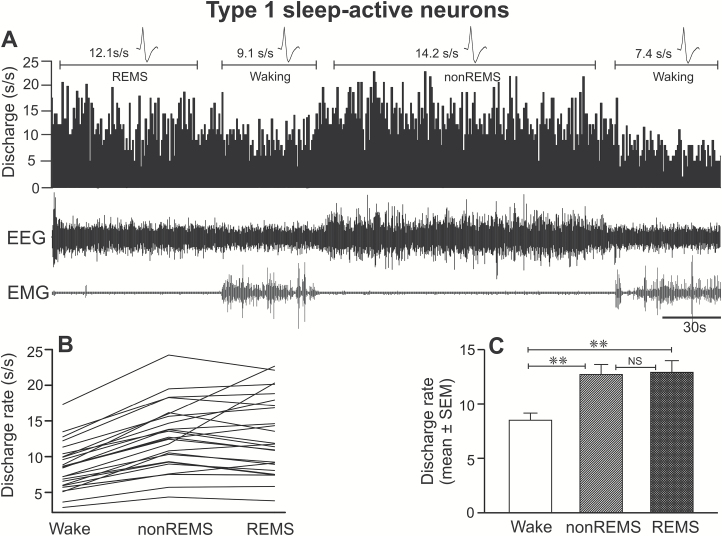
Figure 3.
Discharge characteristics of type 1 sleep-active neurons. (A) A computer-generated 5-minute tracing, showing continuous discharge of an individual type 1 sleep-active neuron across sleep-wake cycle. Individual discharge rates of all the recorded neurons of this type and their mean discharge rate during waking, non-REM sleep, and REM sleep are shown in figures (B) and (C), respectively. The numbers on the top of the marked area represent mean discharge rate during the representative sections of the tracing. The spikes represent averaged waveforms of the action potentials captured during the marked sections and indicate that the same neuron was recorded across the sleep-waking state. These neurons as a group exhibited significantly higher discharge rates during both non-REM sleep and REM sleep, compared to waking. EEG, electroencephalogram; EMG, neck electromyogram; s/s, spikes/second; **p < 0.01; NS, not significantly different.

