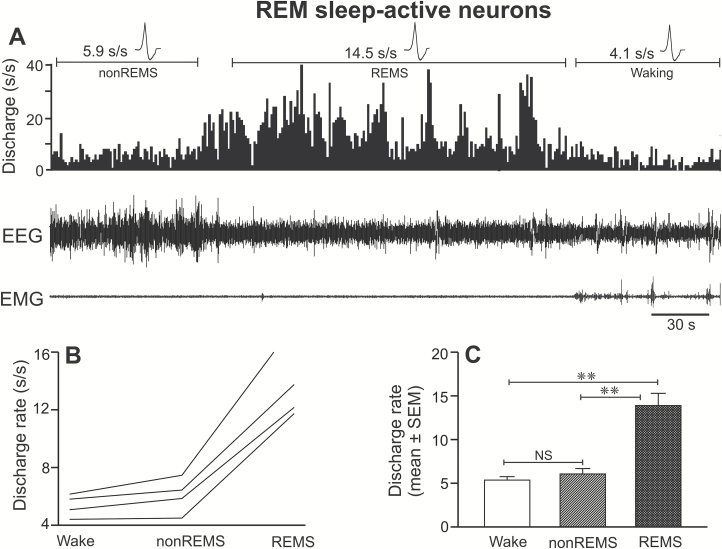
Figure 5.
Discharge characteristics of REM sleep-active neurons. (A) A computer-generated 5-minute tracing showing the discharge of an individual REM sleep-active neuron across sleep-wake cycle. Individual discharge rates (spikes/second) of all the recorded REM sleep-active neurons and their mean discharge rate (±SEM) as a group during waking, non-REM sleep, and REM sleep are shown in figures (B) and (C), respectively. These neurons as a group exhibited significantly higher discharge during REM sleep, compared to both waking and non-REM sleep. Abbreviations are same as in Figure 3.

