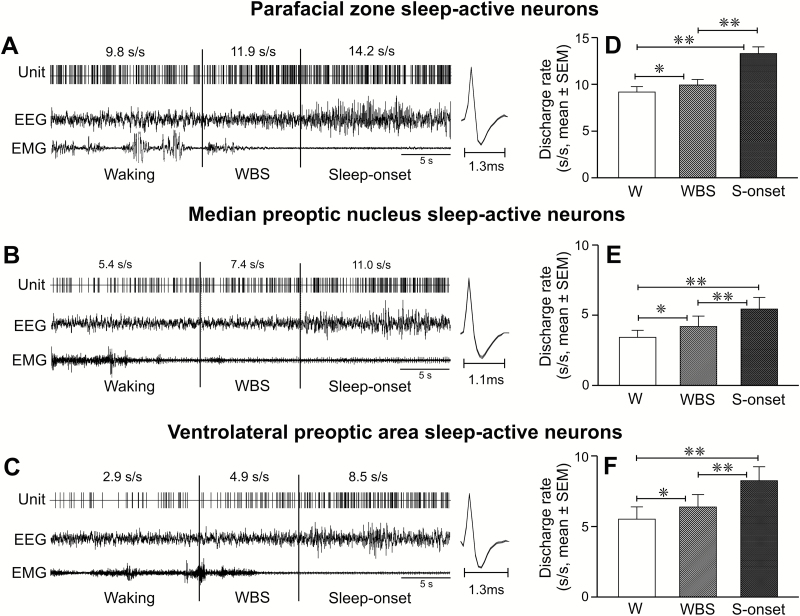
Figure 8.
Discharge changes in parafacial zone, MnPO, and VLPO sleep-active neurons during waking to non-REM sleep transition. (A–C) Computer generated continuous tracing showing discharge activity of individual sleep-active parafacial zone, MnPO, and VLPO neurons during 15 s of waking, last 10 s of waking immediately preceding EEG synchronization, and during 15 s of sleep onset. The spikes on the side represent averaged waveforms of all the action potentials captured during the presented recording period. (D–F) Mean discharge rates of sleep-active parafacial zone, MnPO, and VLPO neurons during waking (except for the last 10 s), during the last 10 s of waking before sleep-onset, and during first 10 s of non-REM sleep onset. Note that all three neuronal groups exhibited increased discharge within 10 s prior to EEG synchronization and sleep-onset. Abbreviations are same as in Figures 2 and 3.

