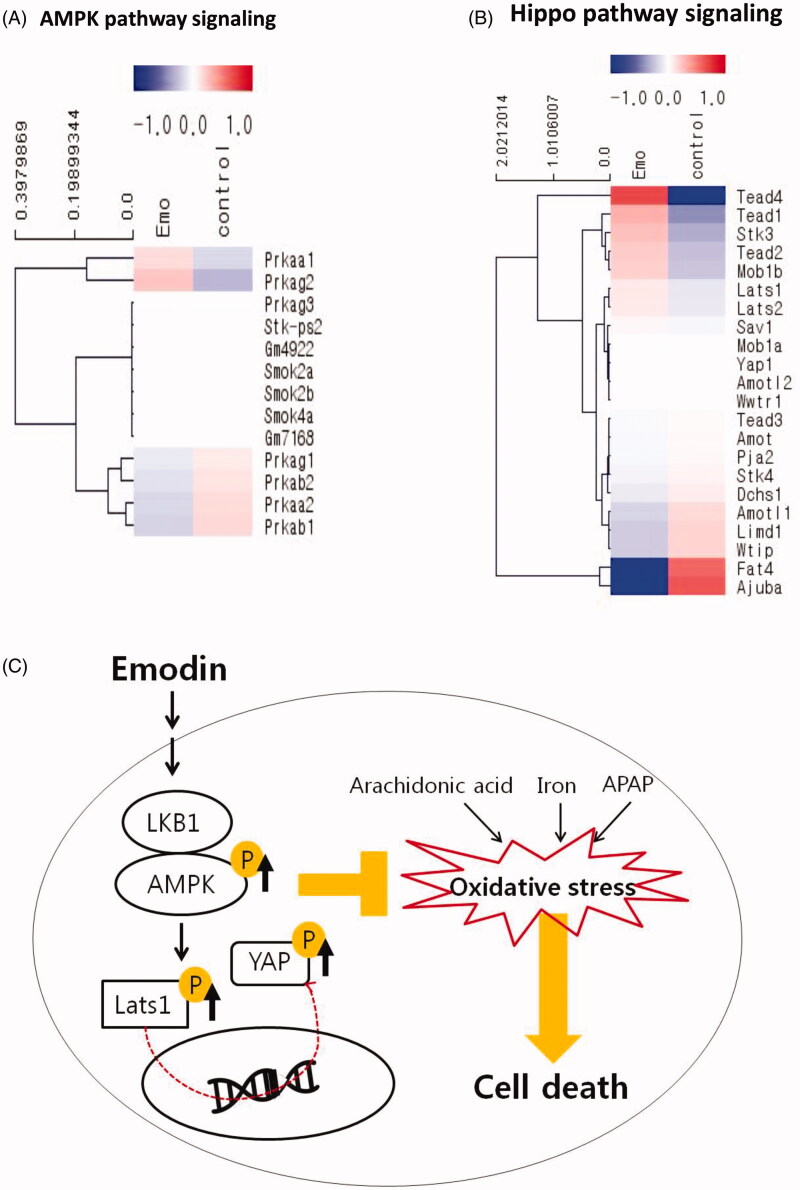
Figure 6.
Activation of AMPK and YAP pathway by emodin in mouse liver. The heatmap depicts the changes in AMPK signalling pathway (A) and Hippo pathway signalling (B) related gene expression between control group and 10 mg/kg Emo-treated group using QuantSeq 3′ mRNA-Seq data. Red indicates higher gene expression values and blue indicates lower gene expression values. (C) Scheme of the mechanism. Emo: emodin.

