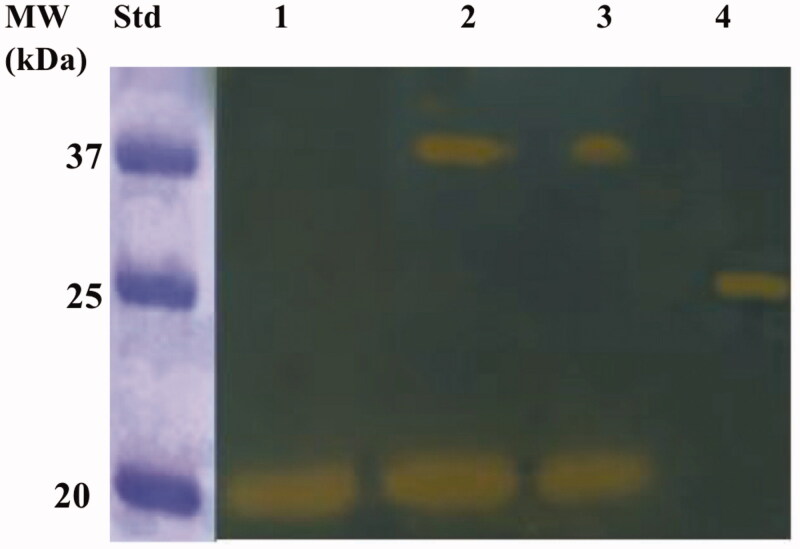
Figure 6.
Developed protonogram showing the CO2 hydratase activity of BteCAι. The purified bacterial ι-CA was mixed with the Loading Solution Buffer (LSB) containing SDS at different concentrations (1.0, 0.5 and 0.1%) and loaded on the gel at 10 µg/well. The yellow bands correspond to the enzyme activity responsible for the drop of pH from 8.2 to the transition point of the dye in the control buffer. Legend: Lane 1, BteCAι with 1% SDS (protein in a monomeric state, MW: 19.0 kDa); Lane Std, Molecular markers. Lane 2 and 3 purified BteCAι mixed with 0.5 and 0.1% SDS, respectively (monomer and dimer); Lane 4, commercial bovine CA, used as positive controls.

