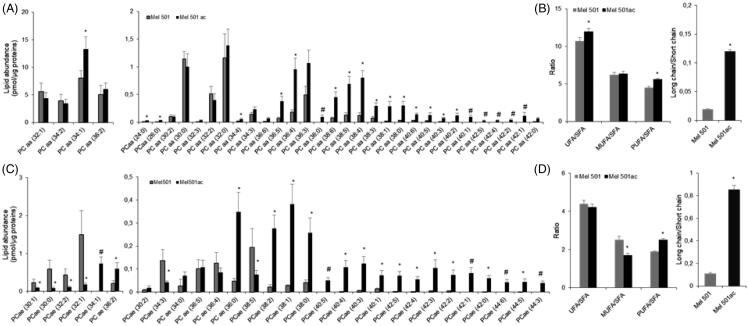
Figure 3.
Molecular species of PCaa (A, B) and PCae (C, D) detected in Mel501 cells cultured in buffered (Mel501) and in acidic conditions (Mel501ac). Panels A and C show PCaa and PCae detected species, respectively. Data are expressed as pmol of lipid species/μg of proteins. Panels B and D show fatty acids saturation level and length in PCaa and PCae, respectively. Saturation level data are expressed as ratio of unsaturated to saturated PC species. Fatty acid length data are expressed as ratio of the total PC species with acyl chains whose sum was > 38 carbons (“long chains”) to PC molecules with acyl chains whose sum was < 36 carbons (“short chain”). Mean values ± SD (n = 6, Mel501; n = 4, Mel501ac) are shown (*p < 0.05, Mel501 vs Mel501ac; # lipid species exclusively found in Mel501ac). SFA, molecular species containing only saturated fatty acids; UFA: molecular species containing unsaturated fatty acids; MUFA: molecular species containing one double bond; PUFA: molecular species containing more than one double bond.

