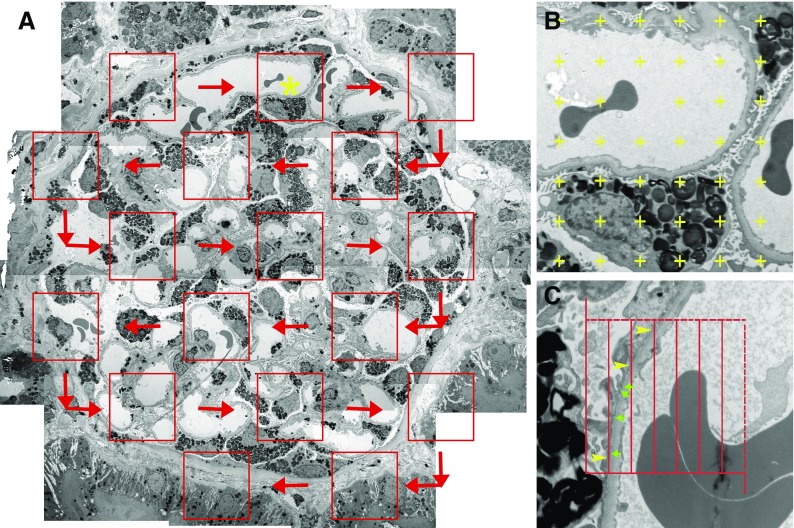
Figure 1.
Illustration of morphometric methods. (A) Systematic uniform random sampling of a glomerular profile for stereologic measurements from a patient with Fabry disease. Red boxes represent locations where higher-magnification images are obtained by transmission electron microscopy. Red arrows show the path of sampling. Yellow asterisk marks the box that is magnified in (B) (montage low magnification, about 8000×). (B) Magnified view of a portion of glomerular tuft with a superimposed point grid used for fractional volume estimation. (C) Higher magnification (approximately 30,000×) image with an unbiased counting frame superimposed for estimation of FPW based on the number of line intercepts with the glomerular basement membrane (yellow arrowheads) and number of slits (green arrows).

