Figure 6.
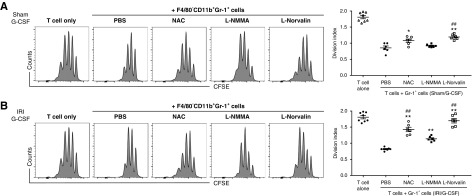
G-CSF–induced MDSCs suppress T cell proliferation mainly through ROS and Arg1. Splenic F4/80−CD11b+Gr-1+ MDSCs prepared from the (A) G-CSF/sham group or the (B) G-CSF/IRI group were cocultured with 5,6-carboxyfluorescein diacetate succinimidyl ester (CFSE)–labeled T cells. NAC, L-NMMA, L-Norvaline, or PBS was added to the coculture of T cells and MDSCs, and T cell proliferation was measured by CFSE staining and expressed as division index. Lines and whiskers in dot plots indicate the mean and SEM, respectively. *P=0.05 compared with the PBS group; **P=0.01 compared with the PBS group; ##P=0.01 compared with the L-NMMA group (ANOVA test, Tukey post hoc analysis).

