Figure 7.
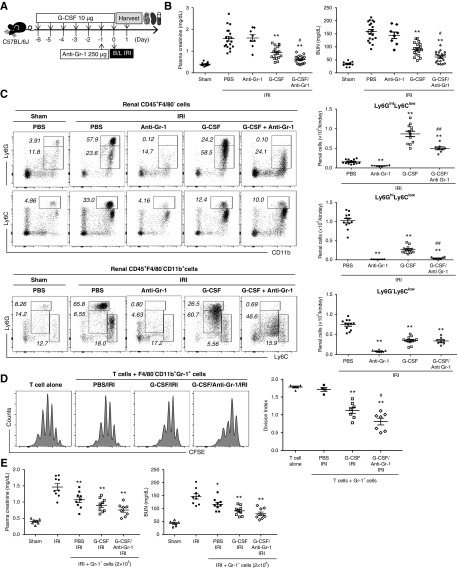
Combined treatment with G-CSF and the anti–Gr-1 antibody synergistically attenuates renal IRI. (A) G-CSF with or without anti–Gr-1 was administered prior to IRI, and kidneys were harvested along with blood sampling on day 1 after IRI. (B) Levels of plasma creatinine and BUN on day 1. (C) Proportions of CD11b+Ly6GhighLy6Clow mature neutrophils, CD11b+Ly6GintLyClow granulocytic MDSCs, and CD11b+Ly6G−LyChigh monocytic MDSCs among renal CD45+F4/80−CD11b+ cells. (D) F4/80−CD11b+Gr-1+ cells sorted from the PBS/IRI group, the G-CSF/IRI group, or the G-CSF/anti–Gr-1/IRI group were assessed for their suppressive activity against T cell proliferation. In vitro T cell proliferation was measured by 5,6-carboxyfluorescein diacetate succinimidyl ester (CFSE) and expressed as division index. (E) F4/80−CD11b+Gr-1+ cells sorted from the PBS/IRI group, the G-CSF/IRI group, or the G-CSF/anti–Gr-1/IRI group were adoptively transferred to mice at 1 day prior to IRI. Levels of plasma creatinine and BUN 1 day after IRI. Lines and whiskers in dot plots indicate the mean and SEM, respectively. B/L, bilateral. *P=0.05 compared with the PBS/IRI group; **P=0.01 compared with the PBS/IRI group; #P=0.05 between the G-CSF/IRI group and the G-CSF/anti–Gr-1/IRI group (ANOVA test, Tukey post hoc analysis); ##P=0.01 between the G-CSF/IRI group and the G-CSF/anti–Gr-1/IRI group (ANOVA test, Tukey post hoc analysis).

