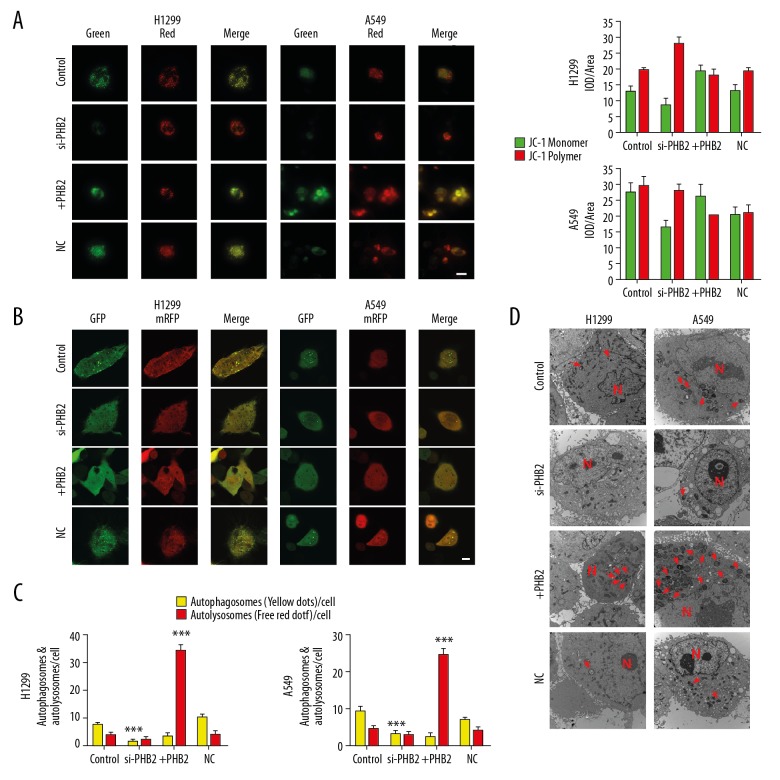
Figure 5.
PHB2 changes MMP and reinforces mitophagy in NSCLC cells. (A) MMP was determined by JC-1 assay. The red and green fluorescence indicates changes in MMP quantified using Image-pro plus software (n=5). Representative pictures are shown. (B, C) Representative images of autophagic flux (autophagosomes: yellow, autolysosomes: red, n=3). Representative pictures are shown. Scale bar indicates 10 μm. *** P<0.001. (D) Representative images of electronic micrographs. Scale bar indicates 500 nm. The arrows (red) depict mitochondrial autophagosomes, and cell nuclei are represented by N (n=5, magnification 10 000×).

