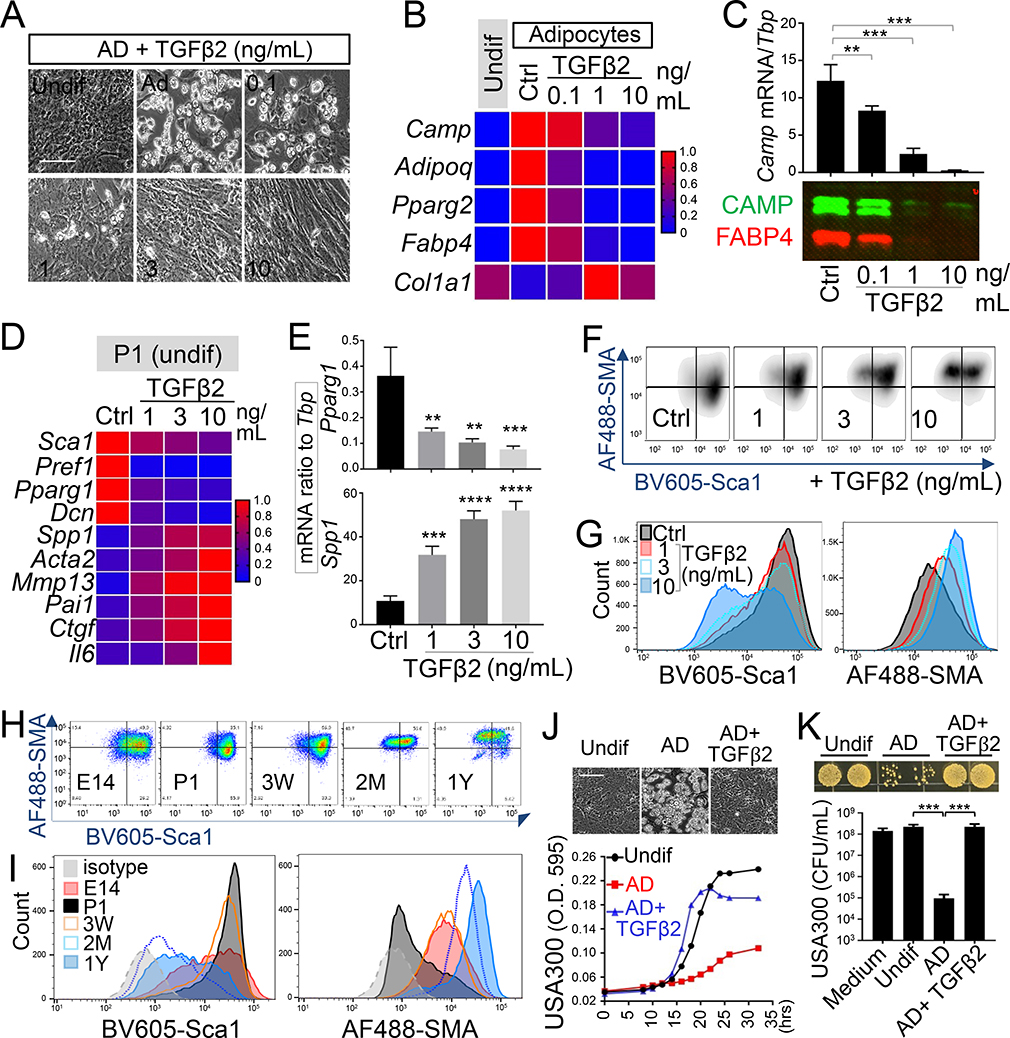
Figure 4. TGFβ2 drives a loss of adipogenic-antimicrobial function of neonatal dFB.
(A-C). Neonatal dFB were treated with increasing doses of TGFβ2 and differentiated in adipocytes. (A). Phase contrast images showing adipocyte formation at day 4 (representative of n=3/group). Scale bar, 100 μm. (B). Heatmap showing the effect of TGFβ2 in suppressing the mRNA expression of adipocyte genes (average of n=3/group). (C). Camp mRNA expression was measured by RTqPCR (top bar graphs) and CAMP and FABP4 protein secretion (lower western blotsl) (representative of n=3/group). (D-G). Neonatal P1 dFB were treated with increasing doses of TGFβ2 for 2 days under undifferentiated conditioned. Heatmap (D) or bar graphs (E) showing relative expression of pro-adipogenic or pro-fibrotic genes as indicated (n=3/group). Flow cytometry plots (F) or overlaid histograms (G) of Sca1 and SMA (representative of n=3/group). (H). Flow cytometry plots of Sca1 and SMA in cultured PDGFRA+THY1+ dFB with indicated age. (I). Overlaid histogram of Sca1 or SMA protein expression shown in H (representative of n=3/group). (J). Growth curve of USA300 in conditioned medium from undifferentiated dFB or differentiated adipocytes (n=3~5/group). Inserted phase contrast images show the effect of TGFβ2 in suppressing adipocyte formation. Scale bar, 100 μm. (K). Bacterial growth image on agar plate or CFU count of USA300 growth at 20 hours in conditioned medium from adipocyte treated with or w/o TGFβ2 as indicated (n=3~5/group). All error bars indicate mean ± s.e.m. * P<0.05, ** P<0.01, *** P<0.001 (one way Anova). Please see also Figure S4.

