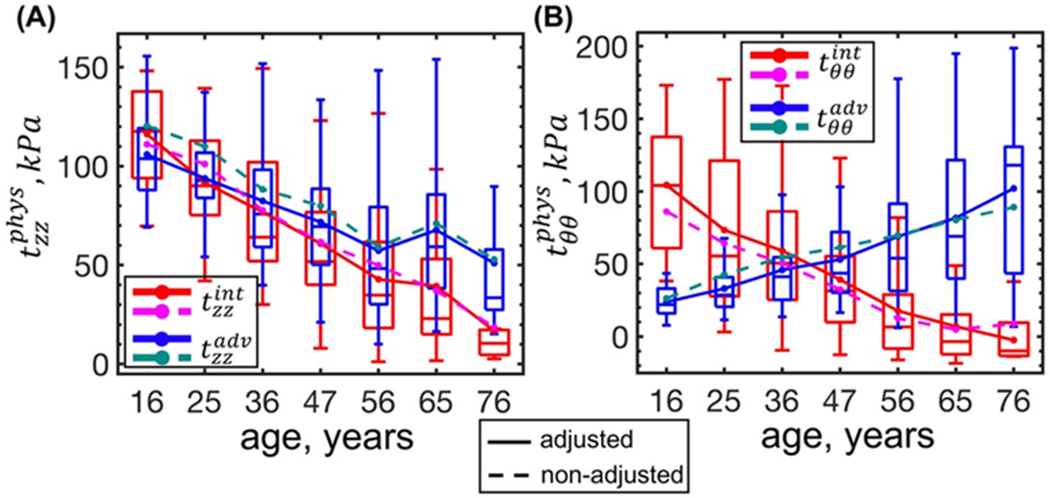
Figure 6:

Changes in the physiologic stress-stretch state with age at the intimal and adventitial surfaces calculated using parameters adjusted (solid lines) and non-adjusted (dashed lines) for the flattening effects. Panels (A) and (B) describe changes in the longitudinal and circumferential stresses at the intimal (red, magenta) and adventitial (blue, dark cyan) surfaces, respectively. Boxes bound 25th and 75th percentiles for each age group, median and average values are marked with a line and a dot within each box, and whiskers extend to the 5th and 95th percentiles. Boxes are plotted for the data adjusted for the flattening deformations.
