
Figure 7:
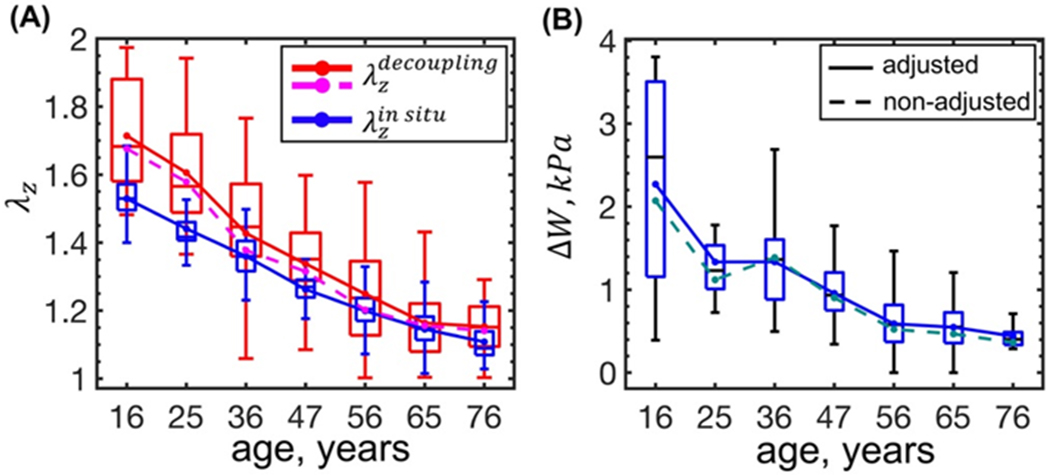
(A) In situ longitudinal pre-stretch (, blue) compared with the decoupling pre-stretch (, red and magenta) at which the internal pressure becomes independent of the axial force; (B) change in the FPA stored energy (i.e. ΔW = Wsys − Wdias) with age calculated using the adjusted parameters (solid lines) and the non-adjusted parameters (dashed lines). Boxes bound 25th and 75th percentiles for each age group, median and average values are marked with a line and a dot within each box, and whiskers extend to the 5th and 95th percentiles. Boxes are plotted for the data adjusted for the flattening deformations.