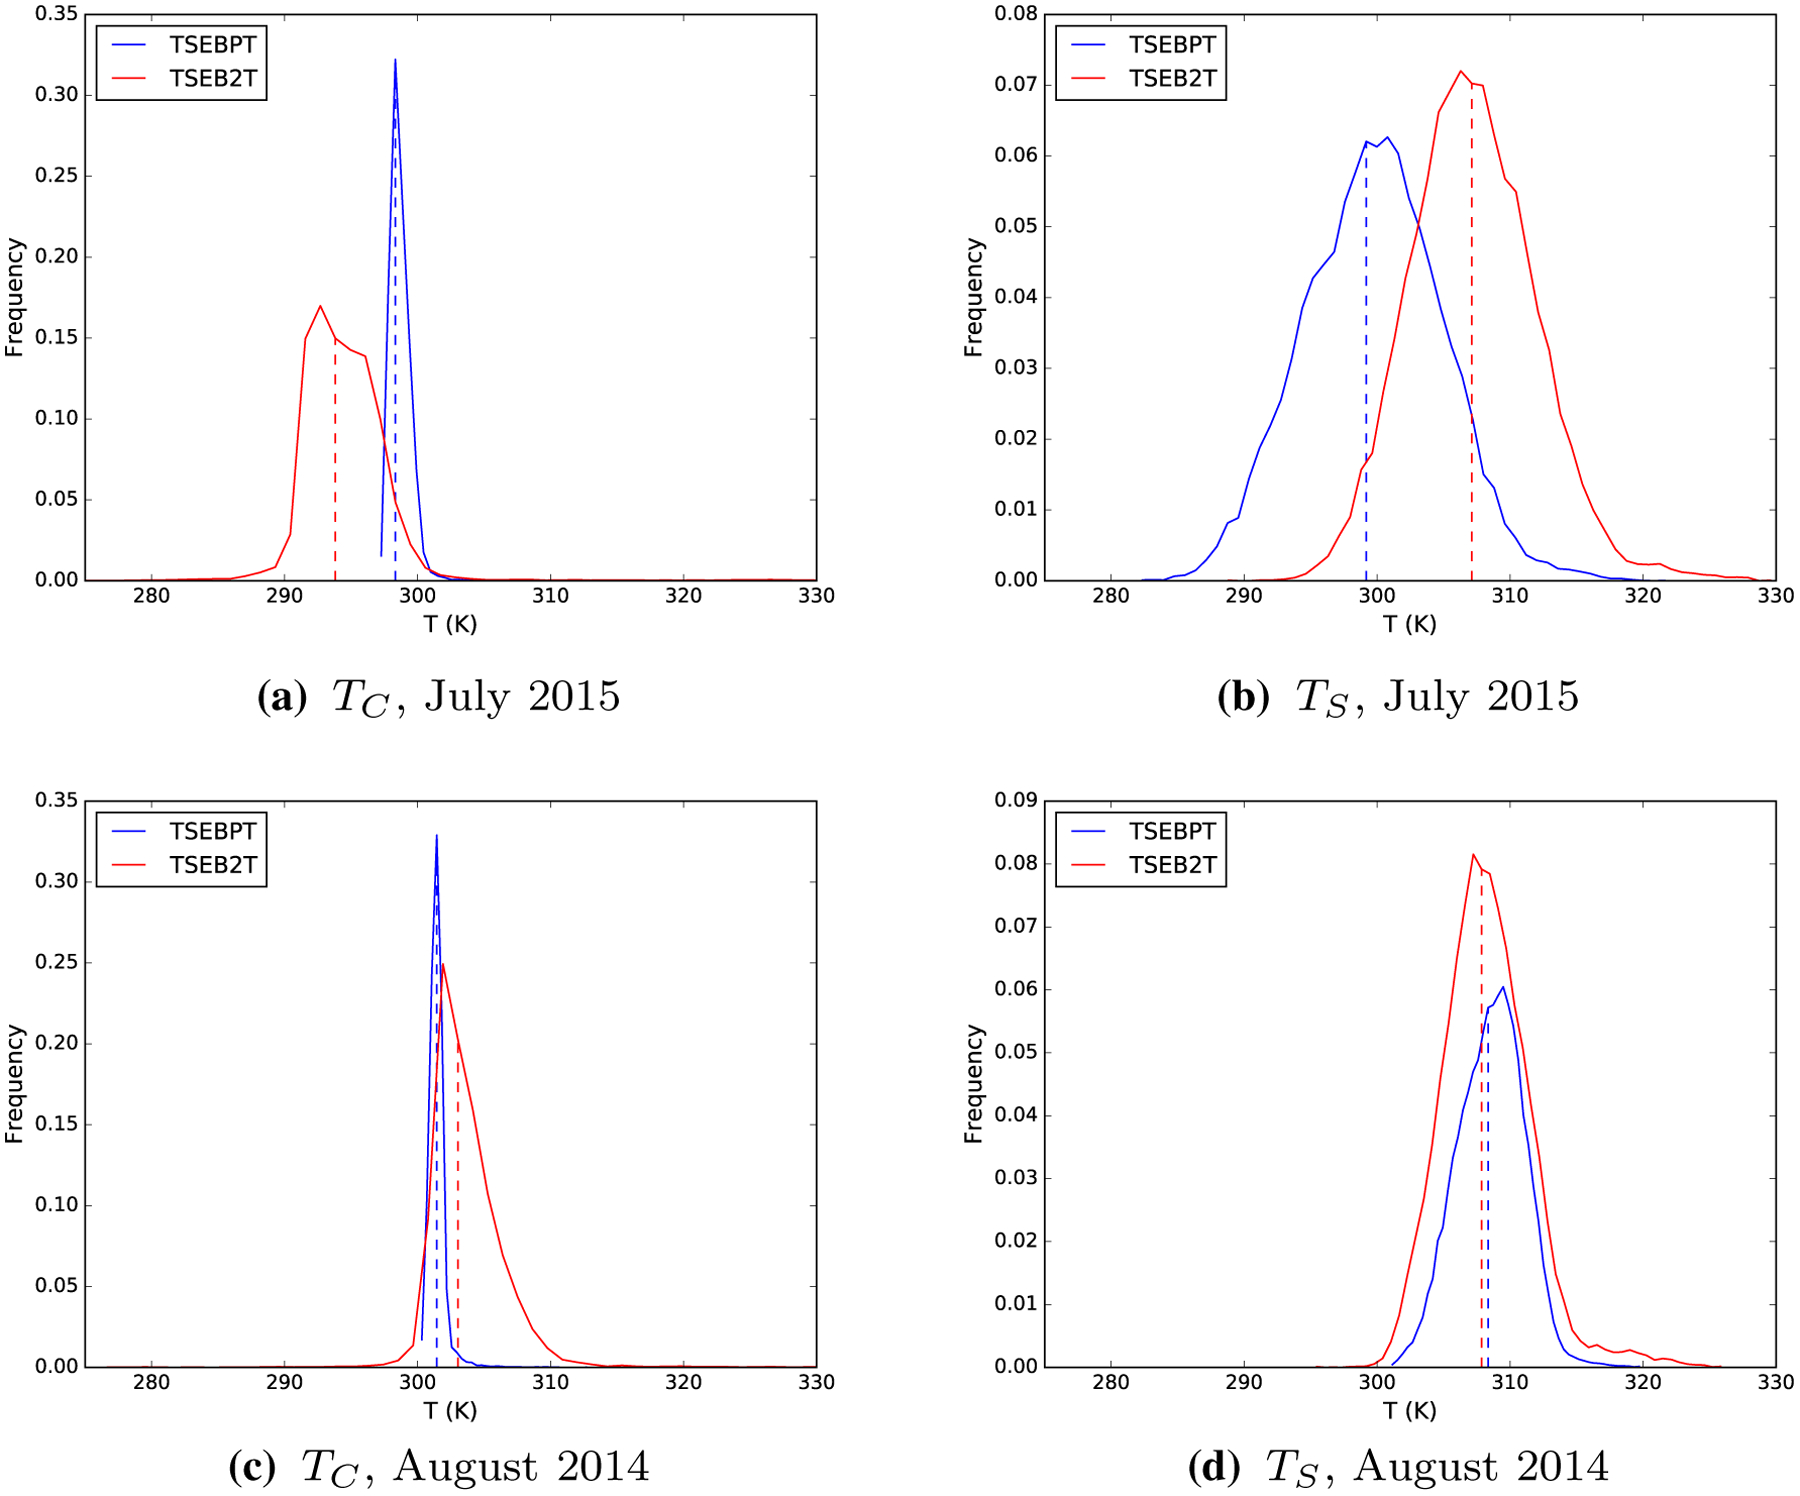
Fig. 9.

Frequency histograms for the component temperatures (TC and TS) estimated in TSEB-PT (blue histogram) and TSEB2T (red histogram).Vertical dashed lines correspond to the average value of the distribution.

Frequency histograms for the component temperatures (TC and TS) estimated in TSEB-PT (blue histogram) and TSEB2T (red histogram).Vertical dashed lines correspond to the average value of the distribution.